
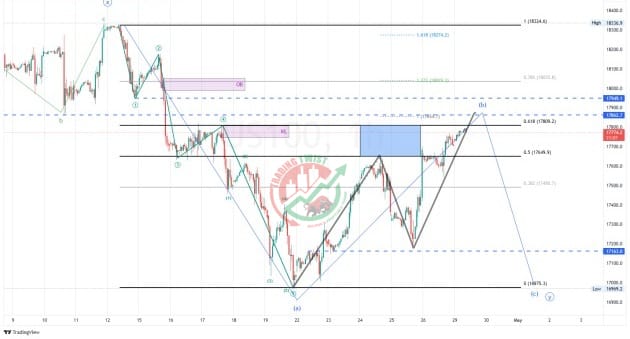
NASDAQ US100 Chart Technical Outlook has a measured move of AB=CD at 17,860
NASDAQ’s recent bias is bearish. It started a downside corrective structure in late March, and there is no indication that the sell-off is over. A three-sub-wave structure is in progress. Prices trade at resistance from the 61.8% Fibo retracement level and a previous swing high. The measured move target of AB=CD is at 17,860, which overlaps with a previously broken support-turned-resistance. Prime resistance is at 18,050. A spike higher is possible but should be short-lived. Supports are located at 17,600 and 17,400.


