
Dow Jones US30 Chart Technical Outlook looks for a break lower to form a Crab pattern.
- The daily timeframe highlights a breakout of the Ending Wedge formation. This pattern has a measured move target of 37,244. It can also be noted from yesterday, and the overnight price action, that levels inside the formation are finding sellers. This is negative for sentiment.
- The 8-hour chart shows a bearish Elliott Wave count. In Monday’s report, we noted resistance at 39,440. This barrier has held. I look for a move lower within the fifth wave.
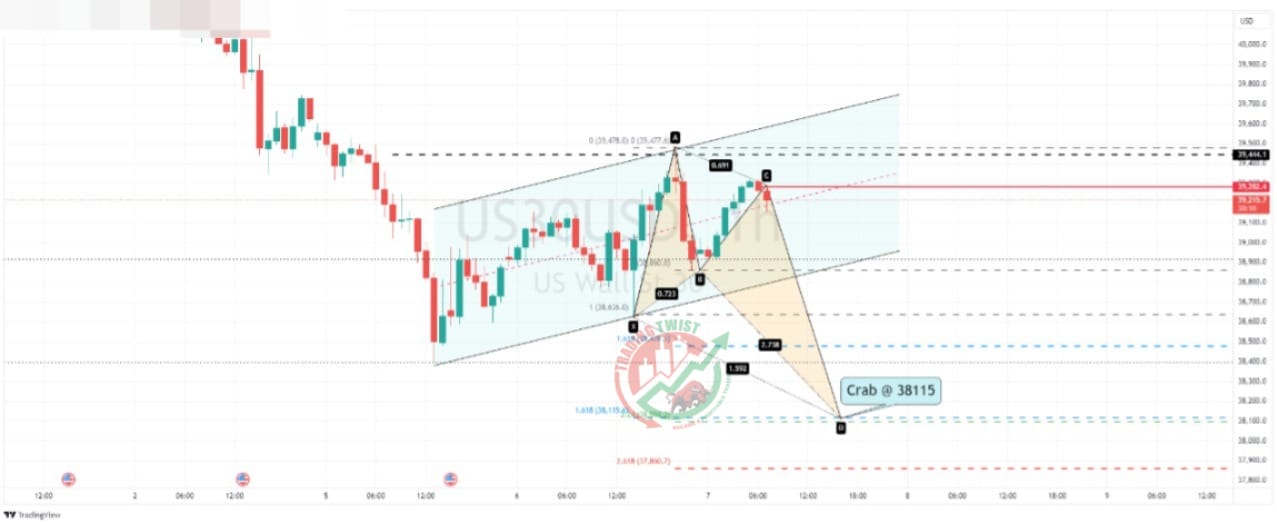
- The one-hour chart highlights a corrective Channel formation. A Crab pattern can also be seen, which will complete close to 38,115. Currently holding below resistance at 39,282.


