Dow Jones US30 Chart Technical Outlook buyers focus on 40,150
Dips continue to attract buying interest and yesterday’s follow through positive momentum resulted in the index trading to the highest level in eight days
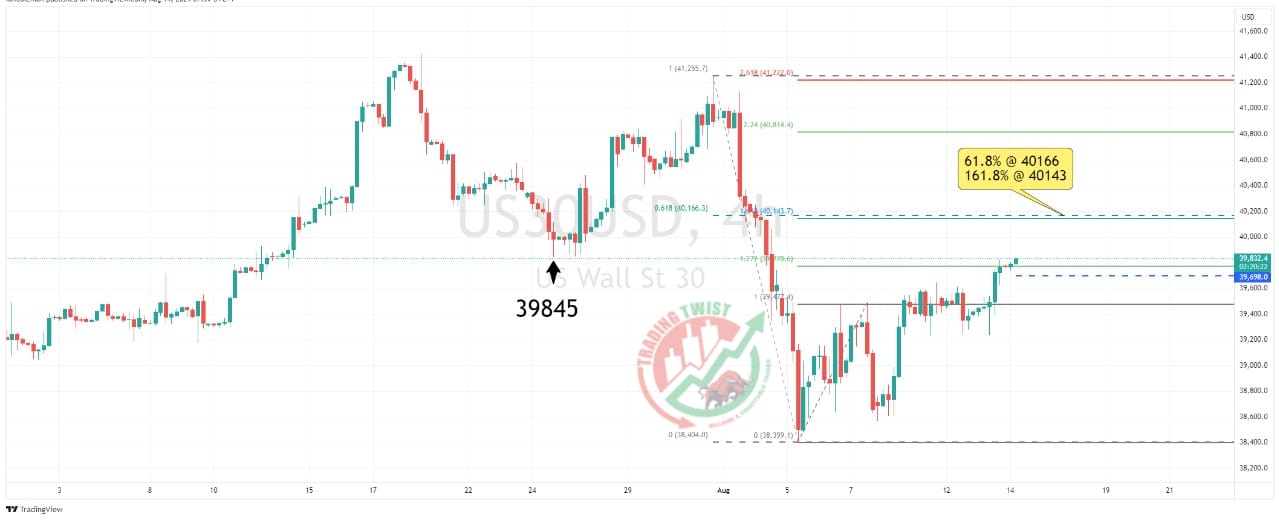
The previous swing low from July 24 is located at 39,845. What was support now becomes resistance.
We have a fibonacci confluence zone close to 40,150. This is:
• 61.8% pullback level at 40,166
• 161.8% extension level at 40,143
Although there is scope for a reaction lower close to 39,845, I would look for intraday dips to find buying interest. Support is located at 39,698.