
Dow Jones US30 Chart Technical Outlook breaks the wedge formations to the downside
The weekly chart highlights a previous swing high at 41,252. The four-hour chart highlights a 261.8% extension level at 41,279. This zone is regarded as a substantial upside barrier for bears.
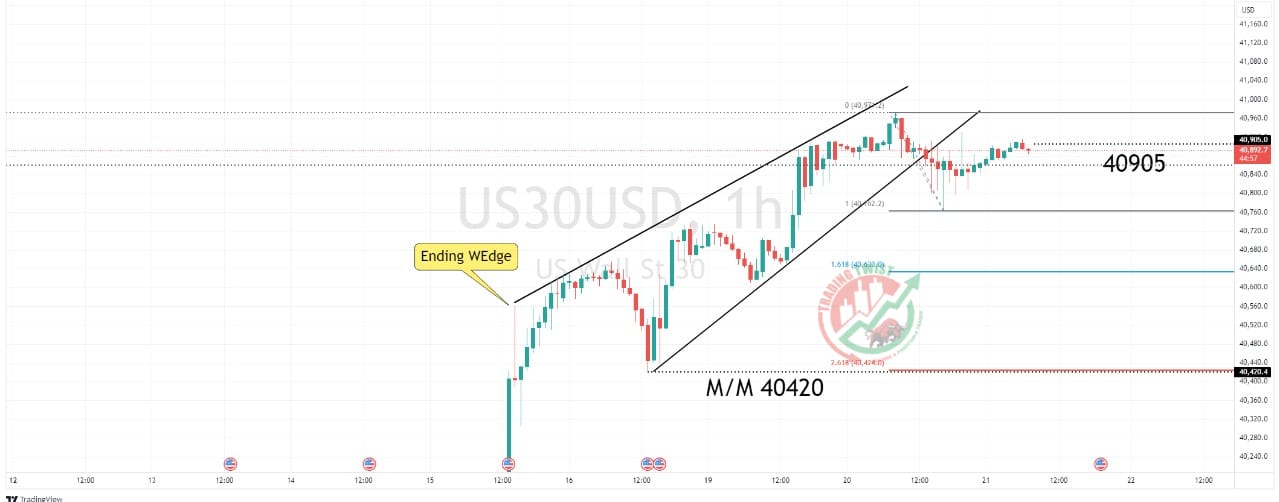
The one-hour chart highlights the breakout of the ending wedge formation. We have failed to see follow-through selling. An interesting note is that the measured move target is at 40,420. We have a 261.8% extension level located at 40,424. Intraday resistance, although mild, is located at 40,905.
In conclusion, I have a mixed view with a mildly bearish bias.


