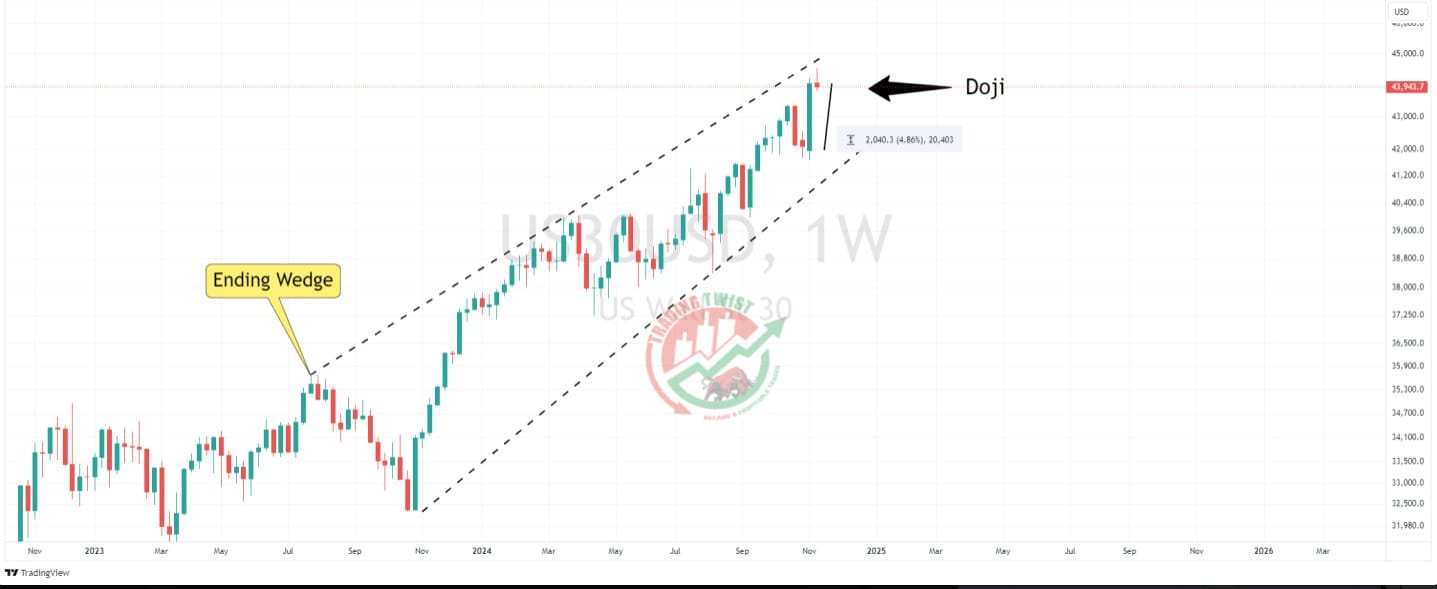
Dow Jones US30 Chart Technical Outlook consolidates after posting an all-time high at 44,525
Last week’s positive price action resulted in net gains of 4.8%. Although we have seen further upside pressure early this week with the index posting an all-time high of 44,525, we are now witnessing a period of consolidation.
This lack of clear direction will likely post a doji-style candle on the weekly chart. We can also note an Ending Wedge pattern that has an eventual bias to break to the downside. We would need a low close next week, close to 42,000, to then form an Evening Doji Star pattern. This formation is often seen at the top of a trend and the start of a new downward bias.
The one-hour chart highlights the completion of a bearish Elliott Wave count (five waves) close to the 261.8% extension level of 43,776. This suggests we are currently within a corrective 3-wave pattern higher.
The 30-minute chart highlights the building of a bearish Bat formation. It would suggest we are currently within the BC leg to the d


