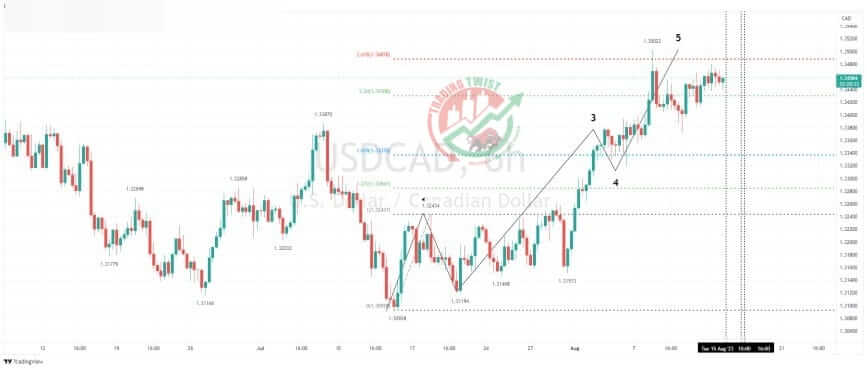
USDCAD Chart Technical Outlook completed a bullish Elliott Wave count at 1.3502, The six-hour chart highlights an impulsive move to the upside and the completion of a bullish Elliott Wave count at 1.3502. That would dictate we are now within the choppy and corrective move lower.
The last five days of price action have seen dramatic spikes in both directions, highlighting the lack of clear direction.
The intraday chart highlights a bearish Ending Wedge pattern. On a break of this morning’s swing low of 1.3439, the measured move target is 1.3372. With the next move lower considered to be the C leg of the corrective formation (A-B-C), we would expect an extension lower towards 1.3275 support.
Conclusion: we have double-data for USD/CAD at lunchtime today. This is the US retail sales and the Canadian inflation data. This could result in an impulsive move lower.


