
USDCAD Chart Technical Outlook price action highlights conflicting patterns
Price action has built conflicting patterns on the 4-hour chart:
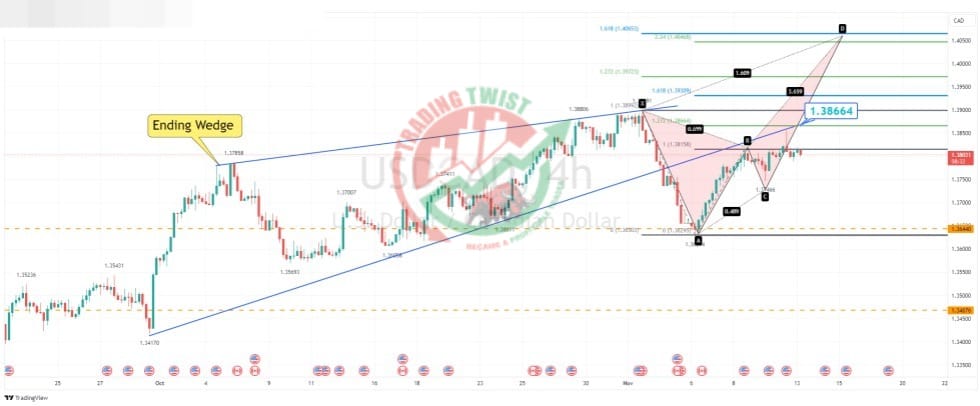
- We have a bearish ending wedge pattern that broke to the downside. Reverse trend line resistance is currently located at 1.3866.
- We’re possibly forming a bearish Crab pattern. This will be completed at 1.4050.
System analysis highlights buying dips at lower levels.
For this reason, I suggest standing aside.


