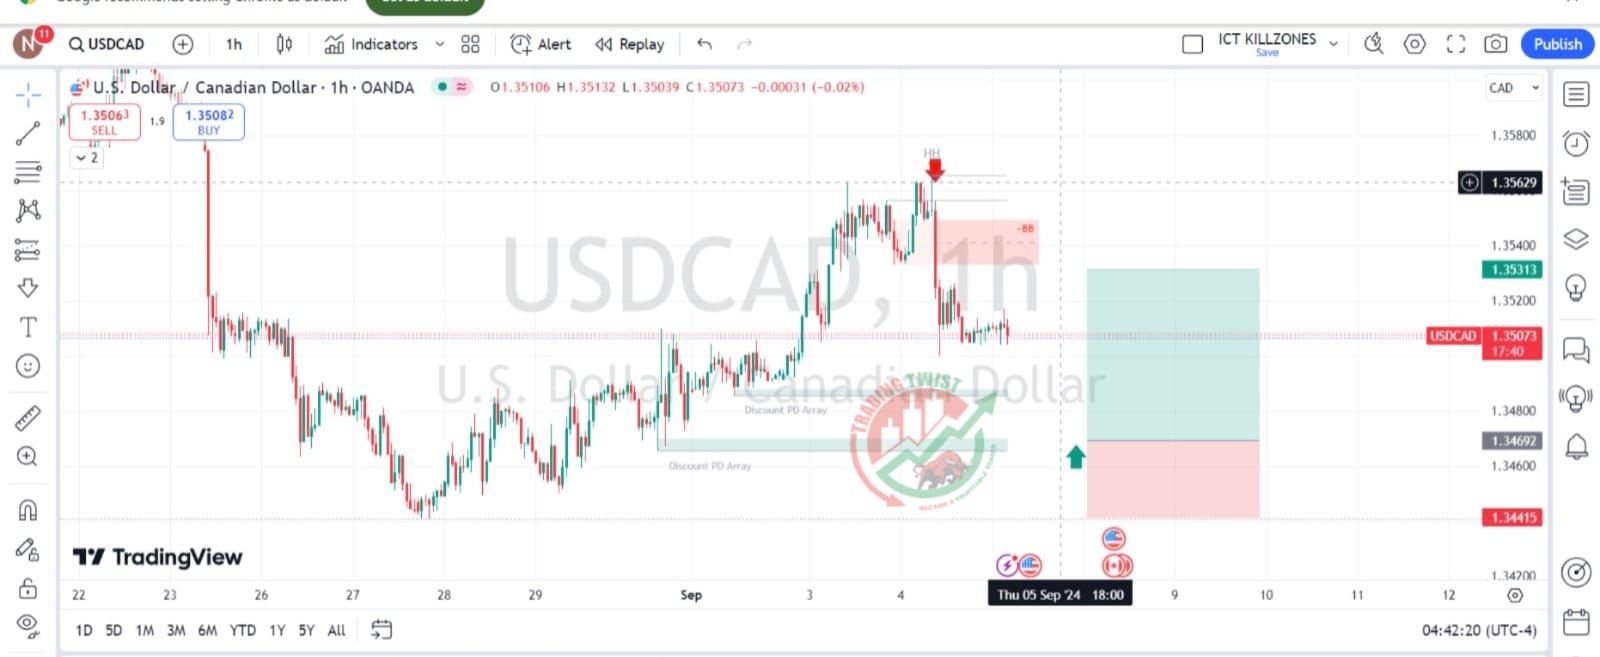
USDCAD Chart Technical Outlook the daily chart highlights a bearish wave is in play inside a lateral structure that started about two months ago. The intraday chart highlights an upward corrective structure (WXY), where wave X is in play with supports seen at 1.3470-1.3440. Resistances are located at 1.3560-1.3615.
It’s a short-term corrective move we are expecting