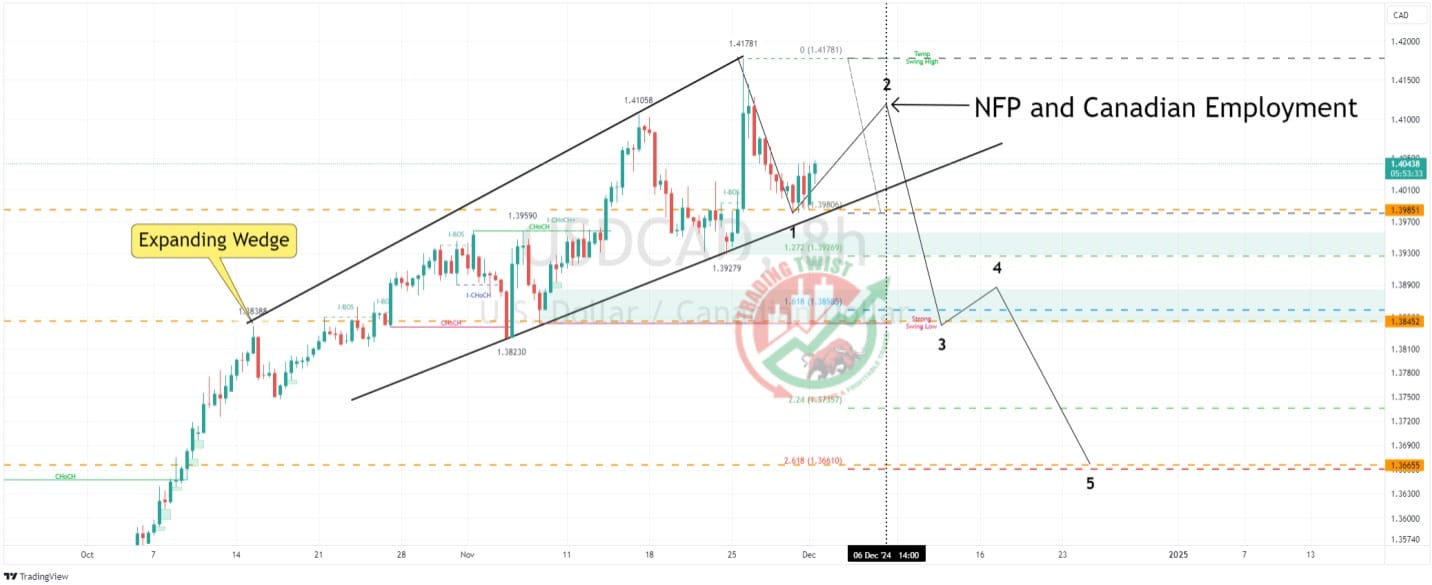
USDCAD Chart Technical Outlook moving higher within the corrective 2nd wave, 261.8% located at 1.3661
Mixed and volatile price action has formed an Expanding Wedge pattern. This formation has a bias to break to the downside. Support levels are located at 1.3985, 1.3845, and 1.3665. Elliott Wave analysis would suggest we are currently correcting higher within the 2nd wave of a bearish Elliott Wave count (5 waves). We have The US nonfarm payroll data and Canadian employment figures on Friday, December 6. This could be a catalyst for a change of trend. This pair is on our watch list for a bearish signal this week.


