
USDJPY Chart Technical Outlook scope for an upside correction to sell into
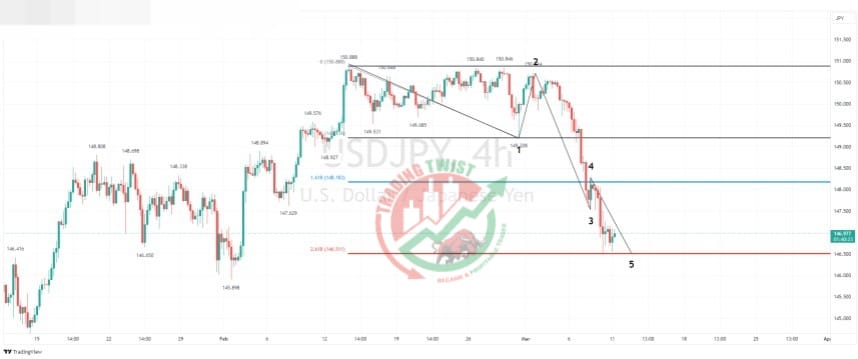
USD/JPY – the one-hour chart highlights an impulsive move to the downside. We have stalled close to the 261.8% Fibonacci extension level of 146.51. Elliott Wave enthusiasts may look to this as the completion of the first bearish five-wave count.
The daily chart highlights the next substantial downside barrier being located at 145.06. This is the projected AB leg of a Bat formation.
Resistance: 148.25 (bespoke), 149.10 (bespoke), 150.88 (swing high)
Support: 146.51 (261.8%), 145.06 (projected AB), 144.31 (61.8%)


