
USDJPY Chart Technical Outlook analysis suggests a sustained bullish correction
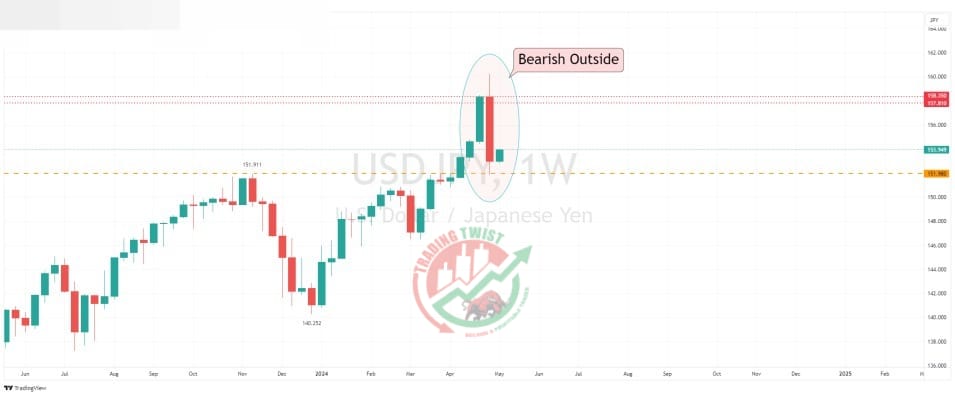
Price action formed a bearish outside candle on the weekly chart. This formation is often seen at the top of a trend and the start of a new downward bias.
The four-hour chart highlights buyers returning just below bespoke support at 151.98. Resistance this week is located at 158.35. We have a 78.6% retracement level of 158.44.
- Bullish price action stalls and corrects close to the 61.8% retracement level of 157.05. This will then form a bearish Gartley pattern close to our weekly resistance at 158.35.
- Bullish price action moves directly to the resistance zone at 158.35-44. This would suggest a higher topping pattern known as a Butterfly formation completing close to 162.65.
Resistance: 157.05 (61.8%), 158.35 (bespoke), 158.44 (78.6%)
Support: 151.98 (bespoke), 151.86 (swing low), 146.55 (bespoke)


