
USDJPY Chart Technical Outlook a move through 157.71 will break formation
Today we have a lack of economic drivers that should affect USD/JPY. On ‘Super Wednesday’ we have consumer price index inflation data, Fed interest rate decisions, monetary policy statements, economic projections, and the FOMC press conference.
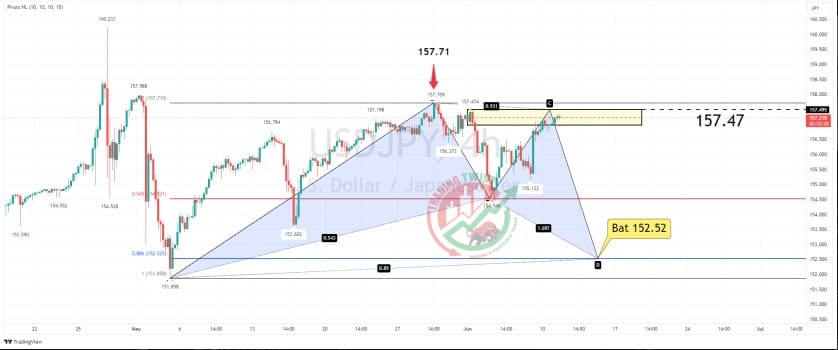
USD/JPY – The intraday chart highlights a possible Bat formation. This will be completed on a move to 152.52. It would suggest we are currently trading within the BC leg. The top of a supply zone is located at 157.47. This pattern would be negated on a move through the May 29 peak of 157.71.
Conclusion: with a lack of economic drivers, there is scope for further consolidation today. The US data will be the catalyst for the next move.
Resistance: 157.47 (supply), 157.71 (May 29 peak), 160.23 (swing high)
Support: 154.54 (June 4 base), 152.52 (Bat), 151.86 (swing low)


