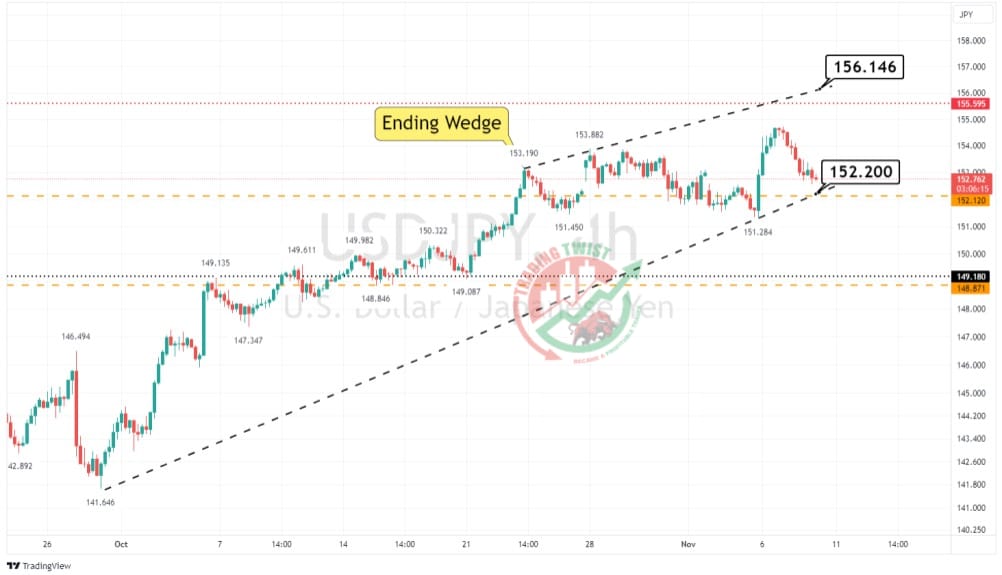
USDJPY Chart Technical Outlook higher highs keep the bullish bias alive, with support at 152.20
Although we have seen a substantial correction to the downside, USD/JPY continues to post higher highs and lows. The four-hour chart is building an Ascending Wedge pattern. This formation has an eventual bias to break to the downside. However, trend line support is located at 152.20. Bespoke support is located at 152.12. It is common for the breakout to occur on the fourth or fifth touch of the trend line. This will only be the third.
In conclusion, I continue to look for dips to be bought. At 155.47, a cypher pattern has been completed. *Trendline resistance is located at 156.15.


