USDJPY Chart Technical Outlook the selloff stalls close to the 151.20 support level
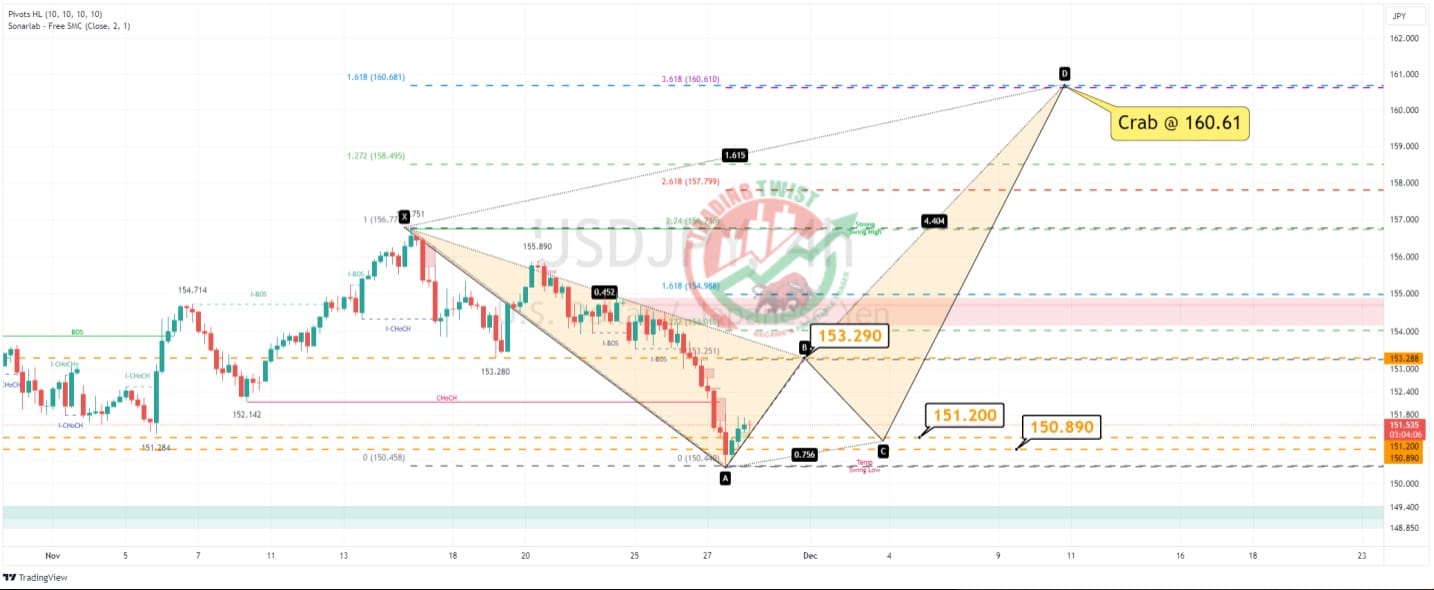
Although USD/JPY traded to the lowest level in 25 days yesterday, the selloff has stalled close to the support zone of 151.20 to 150.89.
The first upside barrier is located at 153.29. Projecting the Fibonacci tool from this level highlights the scope of building a Crab formation. This pattern will be completed at 160.61.
Conclusion: the immediate bias is mildly bullish. The system setup would be buying the completion of the BC leg to ride USD/JPY towards 160.61
Resistance: 153.29 (bespoke), 156.75 (swing high), 160.61 (projected Crab)
Support: 151.20 (bespoke), 150.89 (bespoke), 150.46 (swing low)


