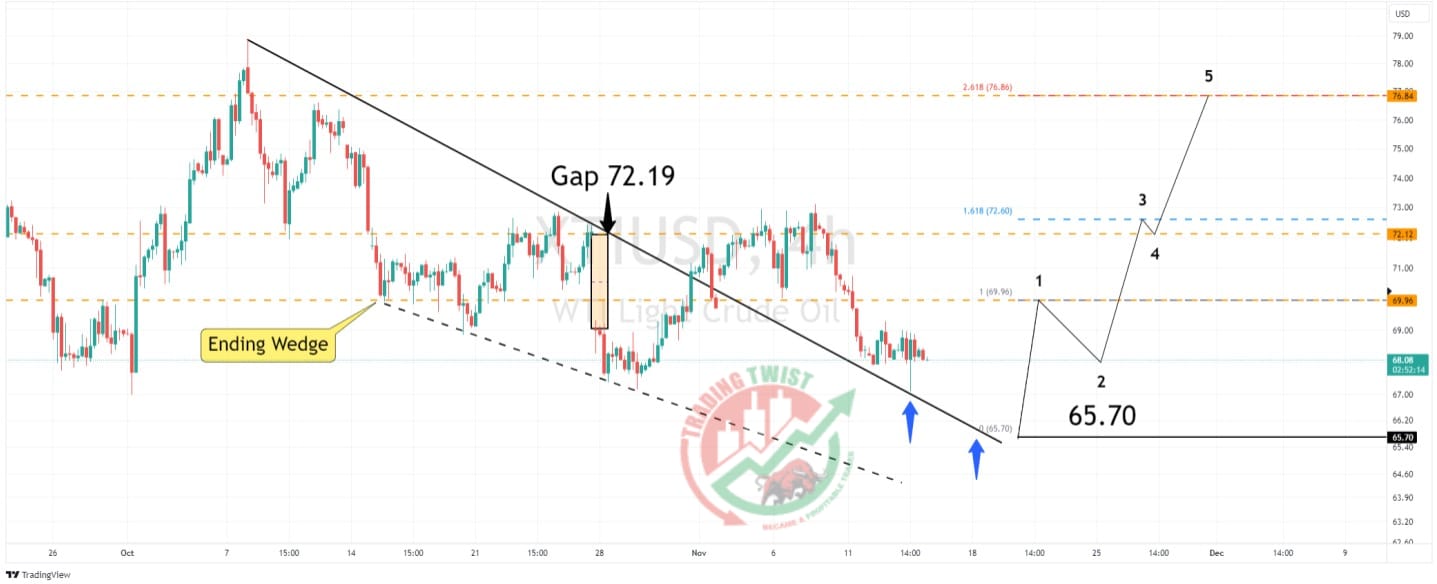
WTI Crude Oil XTIUSD Chart Technical Outlook projected support located at $65.70
We have posted two Doji-style candles on the daily chart, highlighting indecision at current levels. We note that levels close to $67.00 continue to attract buying interest.
The 4-hour chart highlights a breakout of the Ending Wedge formation. This suggests a medium-term bullish bias.
The gap open at $72.19 has been closed.
Yesterday, buyers emerged close to the reverse trend line support. We are seeing further downward pressure in the early European market. Projection analysis offers a support level of $65.70.
Resistance: $69.96 (bespoke), $72.12 (bespoke), $76.86 (bespoke)
Support: $67.15 (swing low), $66.73 (current trend line support), $65.70 (projected support)


