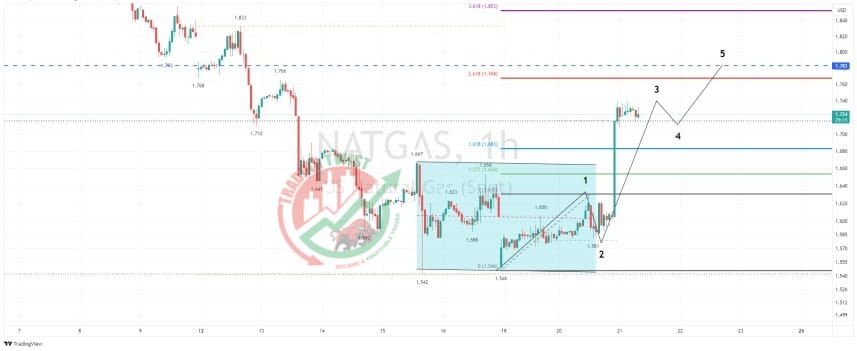
XNGUSD Chart Technical Outlook Nat Gas I have resistance at 1.783. It could be the completion of the first bullish wave count and offer an intraday correction to the downside. Yesterday’s Marabuzo level is located at 1.648

XNGUSD Chart Technical Outlook Nat Gas I have resistance at 1.783. It could be the completion of the first bullish wave count and offer an intraday correction to the downside. Yesterday’s Marabuzo level is located at 1.648