
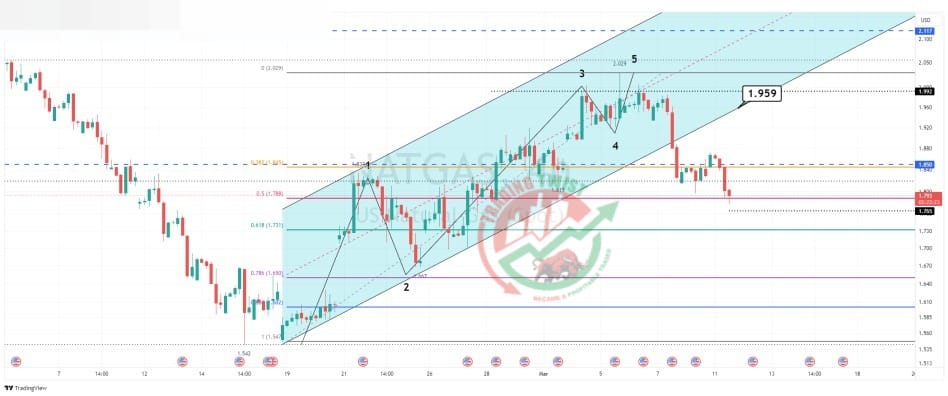
XNGUSD Chart Technical Outlook Nat Gas – completed a short 5th wave at 2.029. This should highlight that we are within a corrective formation lower. With support levels coming in at 1.765, 1.731, and 1.650, I would only look to sell into strength. Reverse trend line resistance from the channel breakout is located at 1.959.


