
Nat Gas XNGUSD Chart Technical Outlook trades within the 5th wave
Although the commodity posted an indecisive doji stole candle on Monday, dips continue to attract buying interest. Nat Gas is trading at the highest level in 103 days.
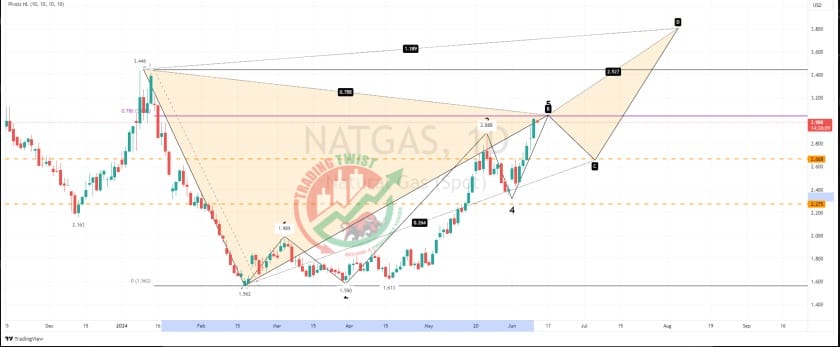
We are close to the 78.6% retracement level located at 3.045. The last move higher can be seen in five waves. Support is located at 2.668 and 2.272.
There is ample scope for a correction to the downside (From the 78.6% retracement). I would look for dips as an opportunity to get long the last drive higher, breaking the previous swing high of 3.446.


