
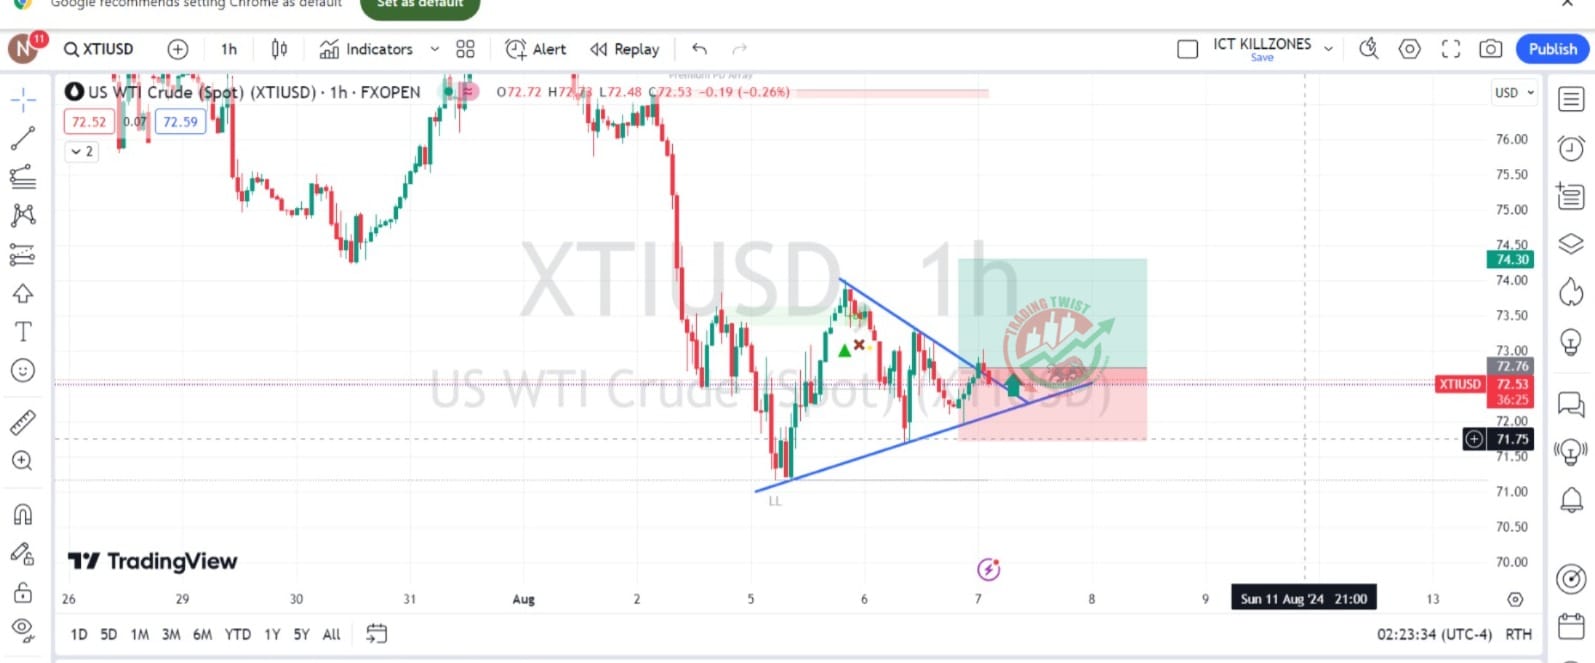
WTI Crude Oil XTI Chart Technical Outlook set to resume falls as Mid-East tensions ease, support at $71.75 in play.
Another day has passed with only the “normal” hostilities in the Middle East. Iran and its proxies seem content with keeping Israel on the edge, and not needing to fire any shot. What’s next? It is hard to know what will happen, but markets have little patience, and the lack of any immediate escalation means pressure on oil prices.
The bigger downside driver for oil came from the market turmoil, that triggered a “sell-everything” mode on Monday. While that has calmed, there is no fresh upside catalyst. I expect crude prices to drift lower.
Support is at $71.75, the recent low, and it is followed by $70.47. Resistance is at $73.75 and $74.60. The broad trend is to the downside, and the commodity’s price is not oversold – the 4h-RSI is above 30.


