
XTIUSD Chart Technical Outlook on H1 and H4 time frame,The four-hour chart highlights oil stalling at a confluence zone$77.04:
- $77.04 is a 61.8% pullback
- $77.01 is a 161.8% extension
Both of these Fibonacci levels suggest a correction to the downside in either a fourth wave or the BC leg.
We can also note an ending wedge formation.
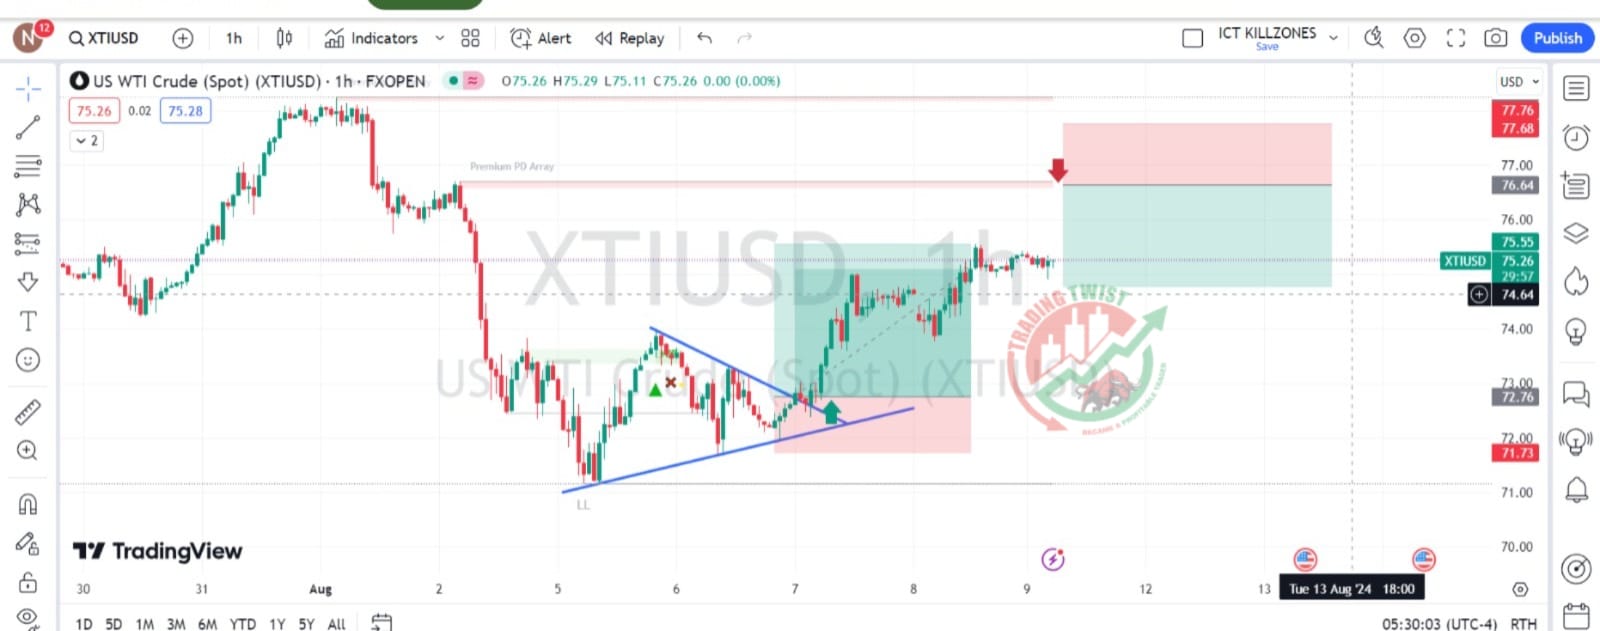
The one-hour chart highlights an inside Bat formation. This morning’s price action has produced a sell signal. Risk-reward is favorable at 4.3R
Sell Limit order: XTI/USD at $76.70
SL: $77.00
TP1: $75.41


