
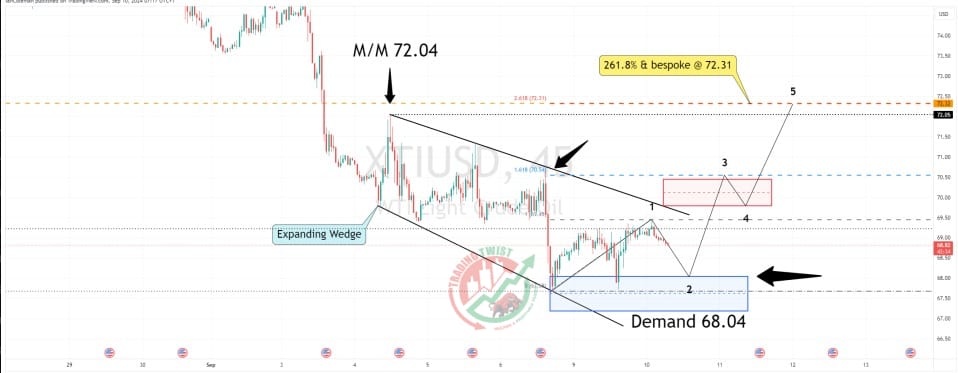
Oil XTIUSD Chart Technical Outlook moving lower within the 2nd wave, support located at $68.04
The monthly chart highlights Oil (XTI/USD) breaking out of the symmetrical triangle formation to the downside. The selloff has stalled close to the previous swing low of $67.70. Reverse trend line resistance is located at $72.40. With bespoke resistance at $72.31, I look for corrective rallies to find selling interest on a medium-term basis.
The intraday chart highlights an expanding wedge formation that has an eventual bias to break to the upside. On a move through the trend of lower highs, currently located at $69.73, the measured move target is $72.04. We have a 261.8% extension level located at $72.31. Bespoke resistance is located at $72.31. We have a demand zone located at $68.04
Conclusion: we are currently assessed as moving lower within the second wave of a bullish Elliott Wave count (5 waves). Prime support is $68.04. I look for a corrective move to the $72.31 barrier.
*Resistance: $69.73 (lower highs), $72.04 (measure


