
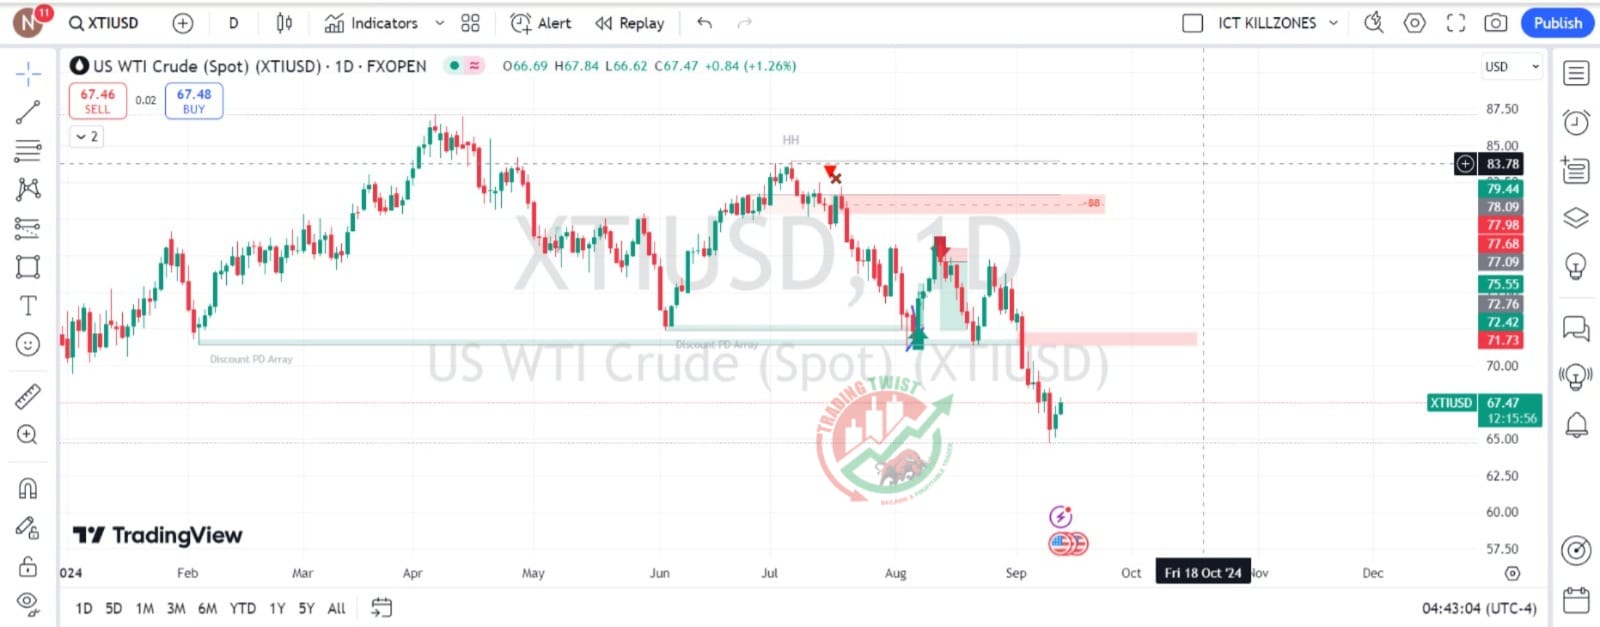
WTI Crude Oil XTIUSD Chart Technical Outlook bounces from the lows, uncertainty about OPEC+ may send it back down toward $65.30.
What goes down, must go up – from time to time. Oil prices have bounced after trading at the $65 handle. WTI Crude Oil (XTI/USD) did not get a boost from inventories’ inventory data, which met expectations – there were no bullish surprises for crude oil.
I see this upside move as limited and prone to fresh falls. The US and China are slowing down. While the European Central Bank has little impact on oil, a dovish message may also contribute to falls.
Support is at $67.21, which is followed by $65.30 and then $64.12. Resistance is at $69.05, then $70.47. Oil is trading down, and it is not oversold.


