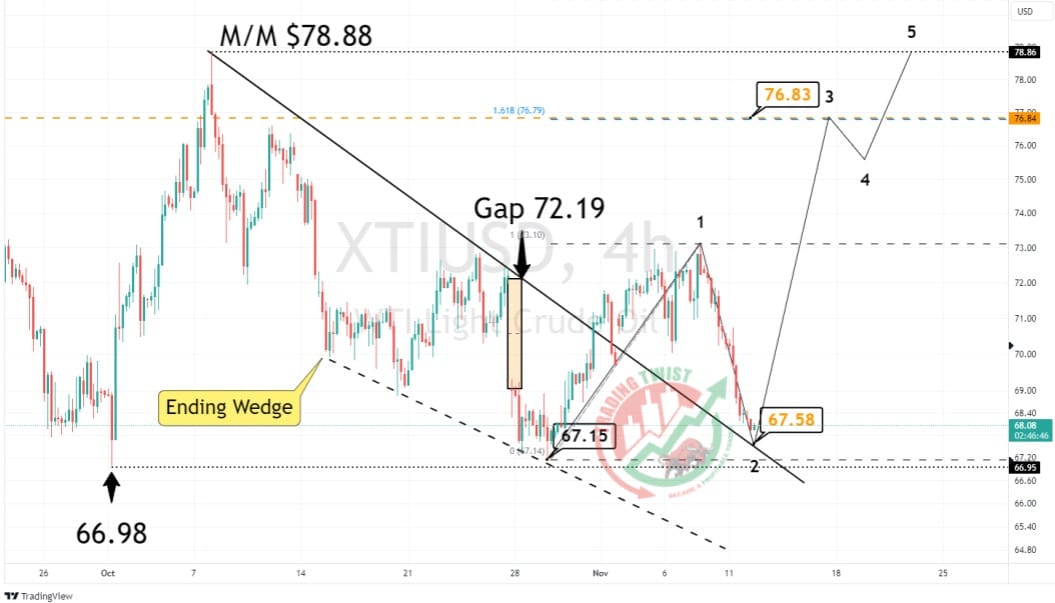
WTI Crude Oil XTIUSD Chart Technical Outlook reverse trend line support at $67.58
Oil broke out of the wedge formation to the upside. Although we have seen a close of the ‘Gap Open’ from October 25th at $72.19, the measured move target of $78.88 has yet to be achieved.
The reverse trend line support from the wedge breakout is $67.58. The previous swing low is located at $67.15. DeMark indicators are close to correction 9 counts on various time frames.
We have a 161.8% extension level located at $76.89. Bespoke resistance is located at $76.83.
Conclusion: although ample scope exists for further mild selling pressure, we now look for buy signals. If Oil stays above $67.15, we look for the bullish and impulsive 3rd wave to the upside (of a 5-wave count)
Resistance: $73.12 (swing high), $76.83 (bespoke), $78.88 (measured move)
Support: $67.58 (reverse trend line), $67.15 (October 29 base), $66.98 (swing low)


