
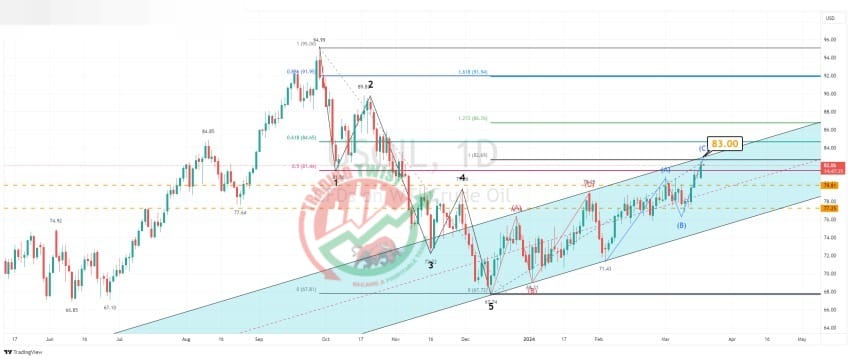
XTIUSD Chart Technical Outlook US Crude Oil continues its corrective cycle
The commodity completed a bearish Elliott Wave count (5 waves) at the December swing low of $67.74. We have witnessed a substantial correction to the upside.
Currently holding within a bullish channel formation. Trendline resistance is located at $83.00.
The inside structure highlights overlapping waves. This is often common in corrective formations. We have a projected upside barrier for a Bat formation located at $82.69.
Bespoke support is located at $79.81.
Conclusion: although there is no clear indication that the bullish correction is coming to an end, with a resistance zone located between $82.69 and $83.00, the risk-reward would be poor to buy from current levels. Bespoke support is located at $79.81. My preferred stance would be to buy into dips.
Resistance: $82.69 (AB), $83.00 (trend line), $84.65 (61.8%)
Support: $79.81 (bespoke), $77.25 (bespoke), $74.95 (trend line)


