
XTIUSD Chart Technical Outlook set to break lower through the expanding wedge formation
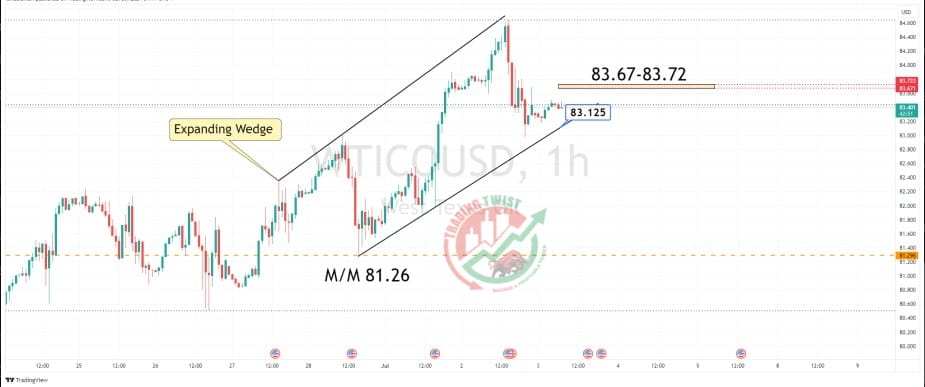
Mixed trading results have resulted in an expanding wedge formation being posted on the intraday chart. On a breakthrough the trend of higher lows at $83.12, the measured move target is $81.26. Bespoke support is located at $81.30.
Intraday resistance is in the small range of $83.67 to $83.72.


