
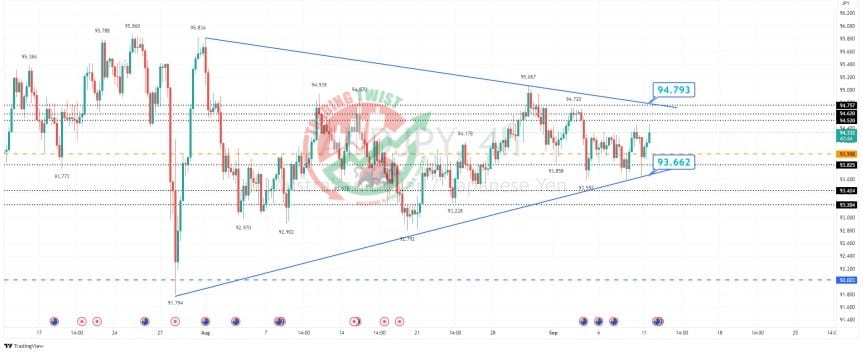
AUDJPY Chart Technical Outlook forms a symmetrical triangle, A prolonged period of consolidation has resulted in a symmetrical triangle being posted on the intraday chart. There is no clear indication of a breakout soon.
The trend of lower highs is located at 94.79. The trend of higher lows is located at 93.66.
Breaking down into shorter time frames, there is scope to build a bearish Gartley pattern. This will be completed at 94.75.
With this level being close to trend line resistance, I would look to this barrier (94.76-94.79) As an opportunity to get short.


