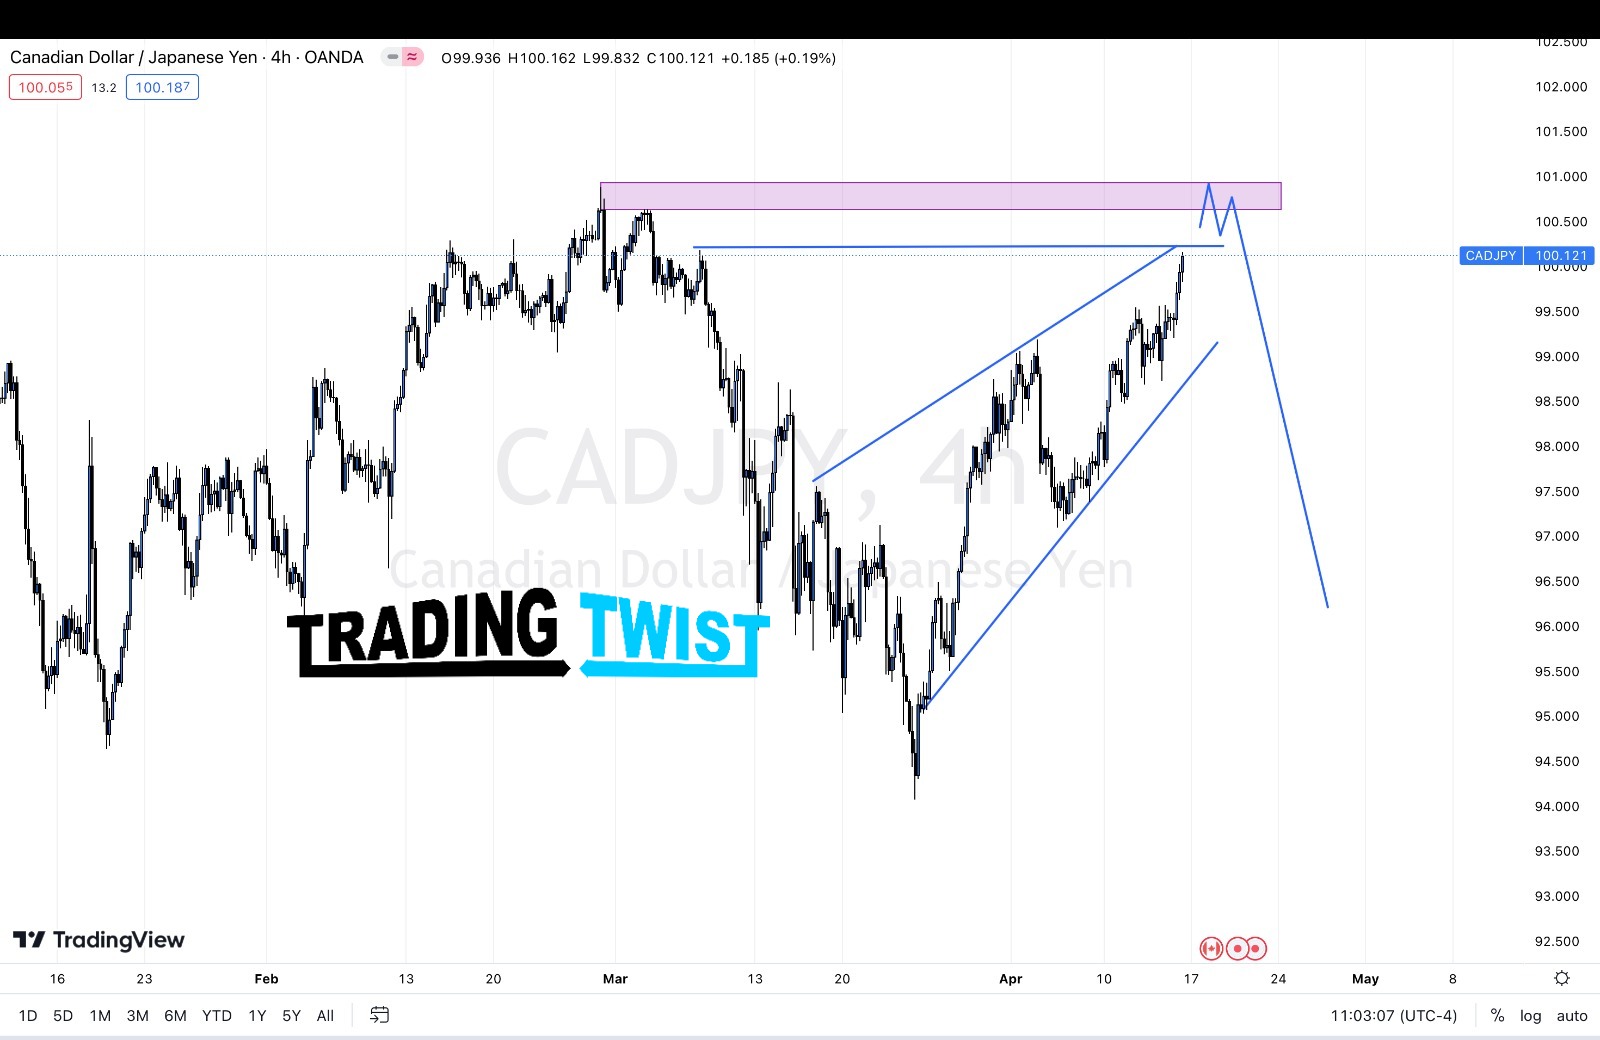
CADJPY Chart Technical Analysis
Resistance Levels: R1 100.15 R2 100.21 R3 100.28
Support Levels: S1 100.02 S2 99.95 S3 99.89
Sentiments Sideways to bearish
On the h4 time frame market is in a rising wedge, looking to test double top and then a bearish breakout expected