
CADJPY Chart Technical Outlook confluence resistance level is located at 103.08
A confluence resistance zone on the weekly chart is located at 103.08.
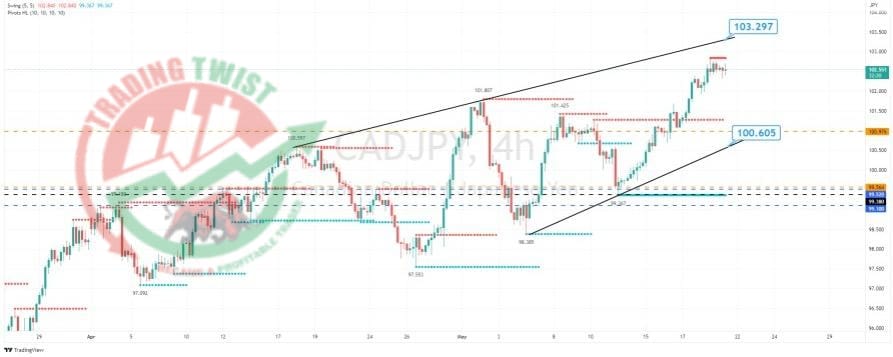
The trend of higher highs is located at 103.30. We are trading at overbought extremes, but dips continue to find buyers.
The ending wedge pattern highlights caution for bulls. The trend of higher highs is located at 100.60 bespoke support is located at 100.97.


