
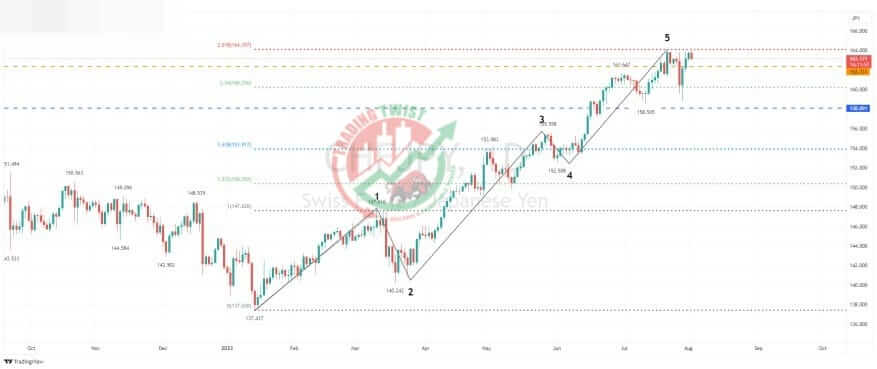
CHFJPY Chart Technical Outlook starts to build a bearish bias the daily chart highlights a 261.8% extension level located at 164.10. We also have a clear definition for the completion of a bullish Elliott Wave count (5 waves). This should indicate that we now see a corrective move to the downside.
Possibly forming a double-top pattern. We need to see a break of the swing low at 158.84 to confirm this formation. I regard this as a risky confirmation setup, with a support barrier located just below there at 158.09.
A bearish outside candle on the four-hour chart does offer an immediate downside bias. The first support level is located at 162.33. We need to see an intraday swing low to be able to project the next solid downside move.


