
DXY Chart Technical Outlook highlights a bullish bias going into the Fed meeting
It is likely that we will see a period of consolidation or profit-taking ahead of tomorrow’s important US figures. We have the Fed interest rate decision, policy statement, and press conference tomorrow evening.
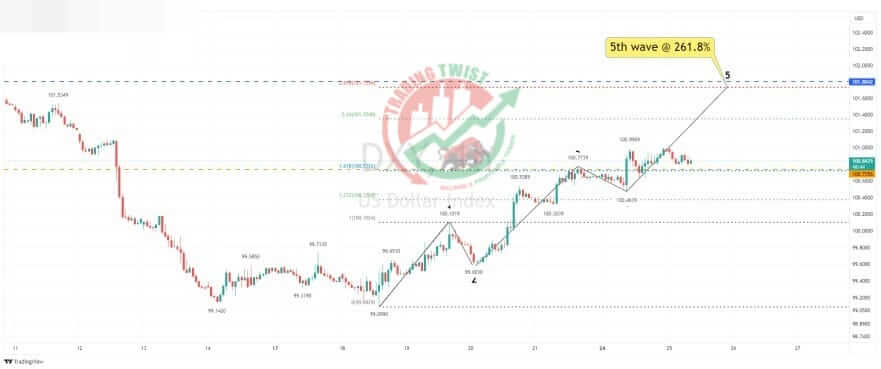
Using correlation, bespoke indicators, cypher pattern analysis, and Elliott Wave theory, the bias looks bullish towards 101.80 for the DXY (US Dollar Index).
DXY one-hour chart: although we have seen a period of consolidation close to our first bespoke resistance level at 100.72, this can be seen as mere fourth-wave consolidation in a bullish five-wave count (Elliott Wave). The 261.8% extension and a common completion level for the 5th wave is located at 101.73. Our bespoke resistance level is located at 101.80.
DXY eight-hour chart: this time frame highlights a projected resistance level for a Bat formation at 101.92. It should also be noted this zone (101.80-92) has been pivotal through April, May, and June.


