
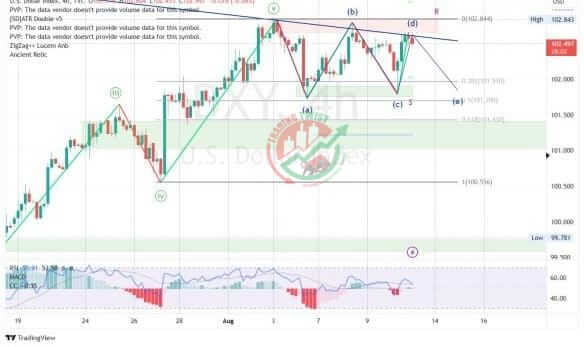
DXY Chart Technical Outlook, which represents the US Dollar Index, is a key tool for forex traders and analysts to gauge the overall strength of the US dollar against a basket of major world currencies.
As of the latest analysis, the DXY chart appears to be approaching a key resistance level, with the 200-day moving average acting as a potential barrier. Traders are closely monitoring the RSI for signs of overbought conditions, which could suggest a possible pullback.
The presence of a bullish flag pattern on the DXY chart indicates that a continuation of the recent uptrend is possible. However, traders should remain cautious and await confirmation through a breakout from this pattern.


