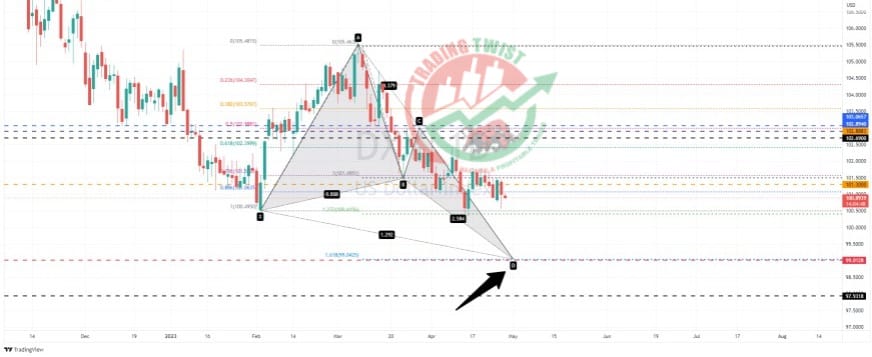
DXYDXY Chart Technical Outlook offers two bearish scenarios going into the US figures, with resistance at 101.35
Big picture analysis is still for a move down to 99.04 to complete the Butterfly formation.
The eight-hour chart highlights a 261.8% extension level located at 99.08. Because of the confluence area, this is the preferred analytical view.
However, it would be unwise to ignore the bearish Bat formation on the four-hour chart, potentially seeing a higher correction to 102.67.
Intraday resistance is located at 101.30.
With these facts in mind, we really need to see a break of the swing low of 100.33 to take out this pattern and continue the bearish trend.


