
DXY Chart Technical Outlook (USD Index) correlation study
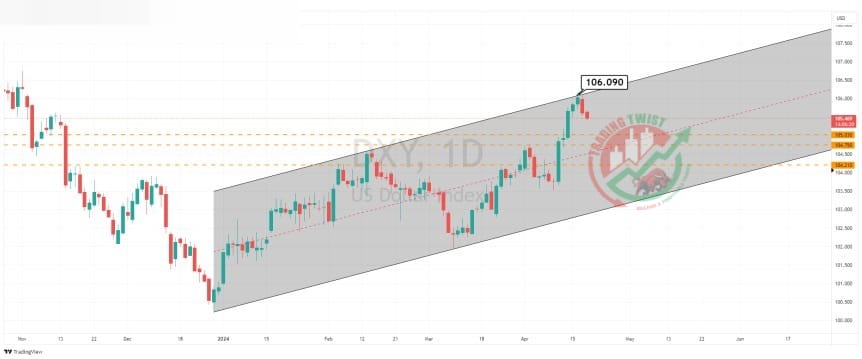
Sellers emerged close to the channel top of 106.09. We have witnessed a substantial correction to the downside.
USD crosses highlight correlation. It suggests further downside pressure for the US Dollar.
DXY (USD Index) – the chart shows a bespoke support level of 104.75. We have the projected support level for a Bat formation located at 104.72. This is -0.67% lower than the current price. I would look for this selloff to expire close to 12 GMT on Friday, April 19. The system setup would be to buy the dip for the BC leg higher.


