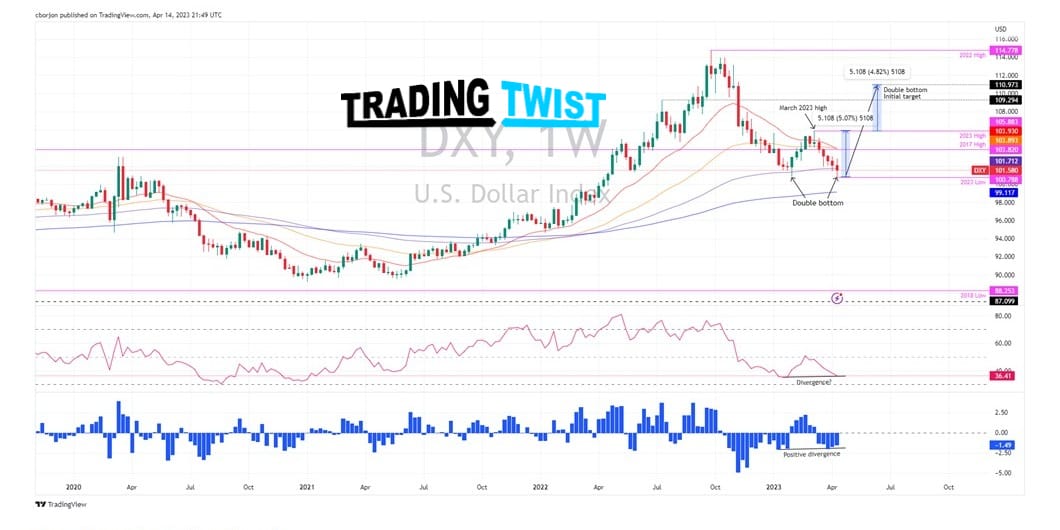
DXY The US Dollar Index found bids at around the YTD lows at 100.788.
USD bulls must retake 104.000 to challenge YTD high at 105.883 and maintain a double-bottom approach.
Contrarily, USD bears must reclaim 100.788 to test the 200-week EMA at around 99.117.
US Dollar Index Price Action
From a weekly chart perspective, the US Dollar Index remains upward biased. The DXY’s fall from around September 2022 highs at 114.728 towards 2023 lows of 100.788 bottomed around the latter, depicting a double bottom formation. Furthermore, the 200-week Exponential Moving Average (EMA) sits comfortably at around 99.117. The Relative Strength Index (RSI) is in bearish territory, but in the recent dip, the RSI is bottoming higher than the prior’s through. The Rate of Change (RoC) also displays that selling pressure is waning, which could pave the way for further upside.
Upside risks in the DXY lie at the confluence of the 50 and 20-week EMAs, around 103.893-103.930. The break above will expose the 2023 high at 105.883, the