
EURUSD Chart Technical Outlook trades within a medium-term bearish Elliott Wave structure
EUR Basket – completed a bullish Crab formation on Jan 30. Although we witnessed immediate upside pressure, we have seen a prolonged period of consolidation for the single currency. This would suggest a Wyckoff Accumulation phase with a possible break to the downside before buyers return.
Correlation – with both single currencies moving in the same direction, I would expect intraday volatility.
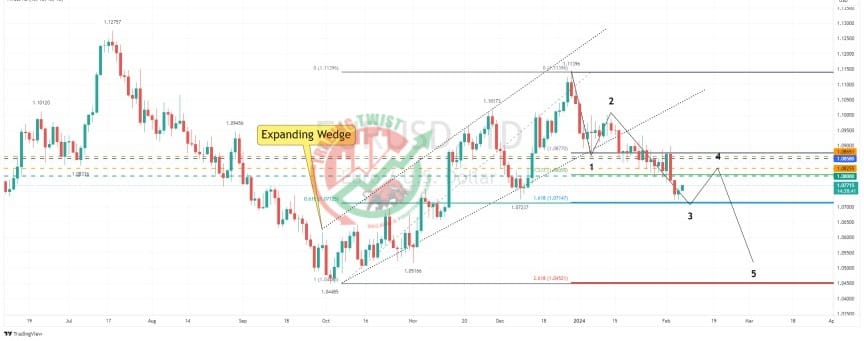
EUR/USD – we have broken out of the expanding wedge formation to the downside. This pattern has a measured move target of 1.0449. The 261.8% extension of the 1.1140-1.0877 move is located at 1.0452. This is the medium-term target zone (1.0452-49).
On a shorter timescale, we have a Fibonacci confluence zone at 1.0715-1.0712. this is:
- 1.0715 is the 161.8% extension of the 1.1140-1.0877 move.
- 1.0712 is the 61.8% pullback level from the 1.0448-1.1140 move.
Conclusion: the medium-term bias remains bearish. I would expect intraday vola


