
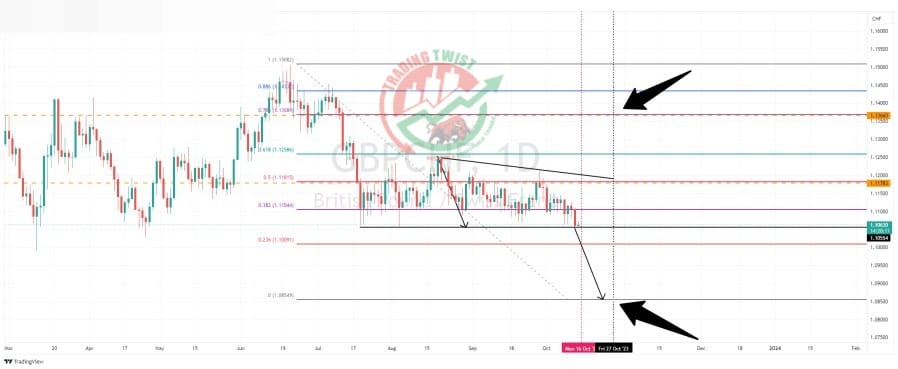
GBPCHF Chart Technical Outlook lower highs offer a negative bias
The fact we have made a base close to 1.1060, and rallies continue to attract selling interest, Price Action has formed a descending triangle pattern on the daily chart. This offers the cross a negative bias.
We are currently breaking through the base of this formation. The measured move target for this pattern is located at 1.0855. The reason I like this target level is that the reverse bespoke resistance is located at 1.1366. That would be the projected 78.6% pullback level from the anticipated base.
I would expect a base to be put in place close to Friday, October 27.


