
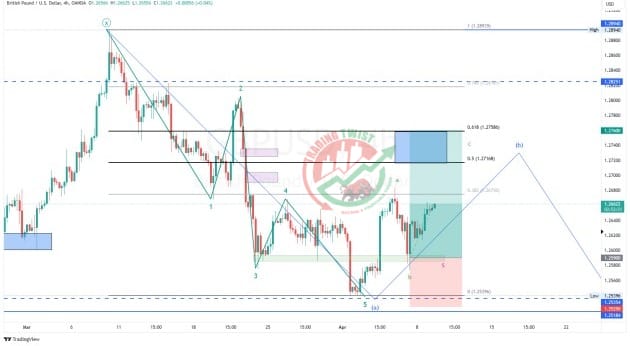
GBPUSD Chart Technical Outlook resumes higher toward 1.2715 ahead of the US CPI data
GBP/USD has been consolidating this year, developing an extended WXY corrective structure. Prices completed a five-wave downside leg as wave a from wave Y. A corrective upside leg is expected. Prices have bounced from a previous swing low in March at 1.2575. A break above 1.2683 confirms the bottom and prints a bullish head and shoulder pattern. The measured move target of the AB=CD structure is at 1.2715, which overlaps with the 50% Fibo level of the recent sell-off. Supports are located at 1.2615 and 1.2575. The US CPI data is due tomorrow.
I have a live buy trade from 1.2590 and SL at 1.2525. TP level is modified to 1.2760 (61.8% Fibo level).


