
US CRUDE OIL Chart Technical Outlook stalls at the $87.53 projection
Geopolitical tensions have eased over the Gaza Strip and initial progress was reported in ceasefire talks. This has stalled the progress of US crude oil, for now.
From a technical perspective, we have seen mixed trading for the last two days with spikes in both directions.
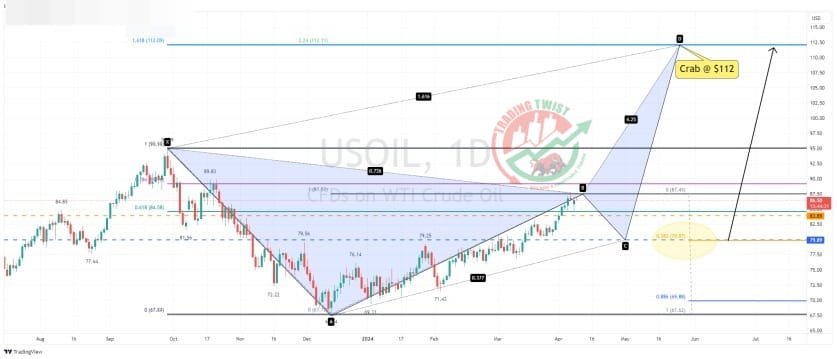
$87.53 is the projected AB leg of a large Crab formation. A common retracement level for the BC leg is 38.2% of the last rally. This is located at $79.87. Bespoke support is located at $79.89.
The intraday chart highlights the Sunday night gap of $86.67 being quickly closed. We have a 261.8% extension level located at $79.92. The smart money concept (SMC) highlights a strong swing high at $87.59. We have a supply zone between $87.30 and $88.05.
Resistance: $87.07 (Monday peak), $87.30 (supply), $87.59 (swing high)
Support: $84.66 (wave 1), $82.85 (161.8%), $79.92-87 (confluence)


