
Gold XAUUSD Chart Technical Outlook, Gold Price Gains Momentum, Nearing Four-Week High Amidst USD Weakness.
Technical Outlook for Gold:
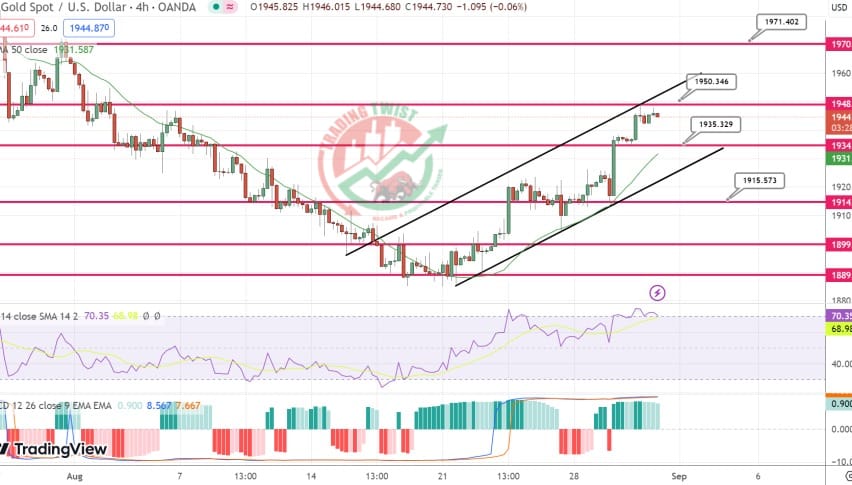
Gold’s price remains under the spotlight as the confirmation of a bullish chart formation, the four-month-old falling wedge, aligns with positive indications from the Moving Average Convergence and Divergence (MACD) indicator and the Relative Strength Index (RSI) at 14.
However, it’s important to note that the RSI is rapidly approaching overbought territory, suggesting limited upside potential for XAU/USD.
In this context, a horizontal area encompassing multiple levels identified since late May, approximately $1,984–85, and the yearly peak recorded in May around $2,067, could present a challenge for Gold buyers as they aim for the theoretical target of the wedge breakout, near $2,140.


