GOLD XAUUSD Chart Technical Outlook corrects lower from the channel top of $1,932
The war in the Middle East has resulted in a flight to safety with Gold being one of the major recipients.
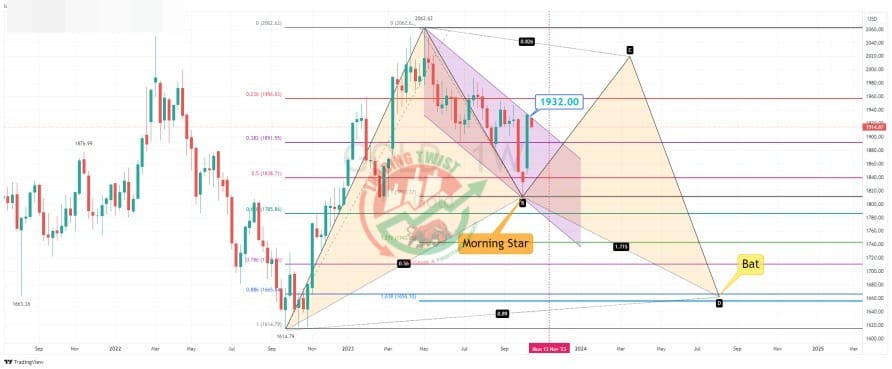
The weekly chart highlights a slightly disjointed Bat formation. This would suggest we are currently moving higher within the BC leg. Although the rally has stalled close to the channel top of $1,932, with this timeframe highlighting a bullish Morning Star pattern, dips are likely to find buyers.
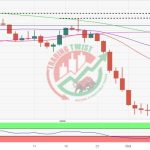
The daily chart highlights the next significant upside barrier being $1,948. This is the projected BC leg of a Bat formation. The daily chart produced a bullish Outside Day on Friday, October 6. This has left a support level at $1,861. We still have the gap open located at $1,832.
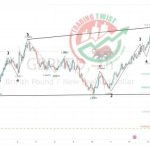
The four-hour chart highlights the possible completion of a five-wave, Elliott Wave count. It should be noted that the previous high from September 20 is located at $1,947.
Conclusion: although we have seen a reaction to the downside from the channel top, there is no clear end