Fibonacci is a mathematical sequence that has been used in chart to describe various phenomena in nature, art, and science. It is also a popular tool among forex traders who use it to identify potential support and resistance levels on the price retracement charts.
The Fibonacci retracement chart is a series of numbers that starts with 0 and 1, and each subsequent number is the sum of the previous two. For example 0, 1, 1, 2, 3, 5, 8, 13, 21, 34, 55, 89, and so on. The ratio of any two consecutive numbers in the sequence is approximately 1.618, which is known as the golden ratio. This ratio also appears in the proportions of many natural objects, such as flowers, shells, and spirals.
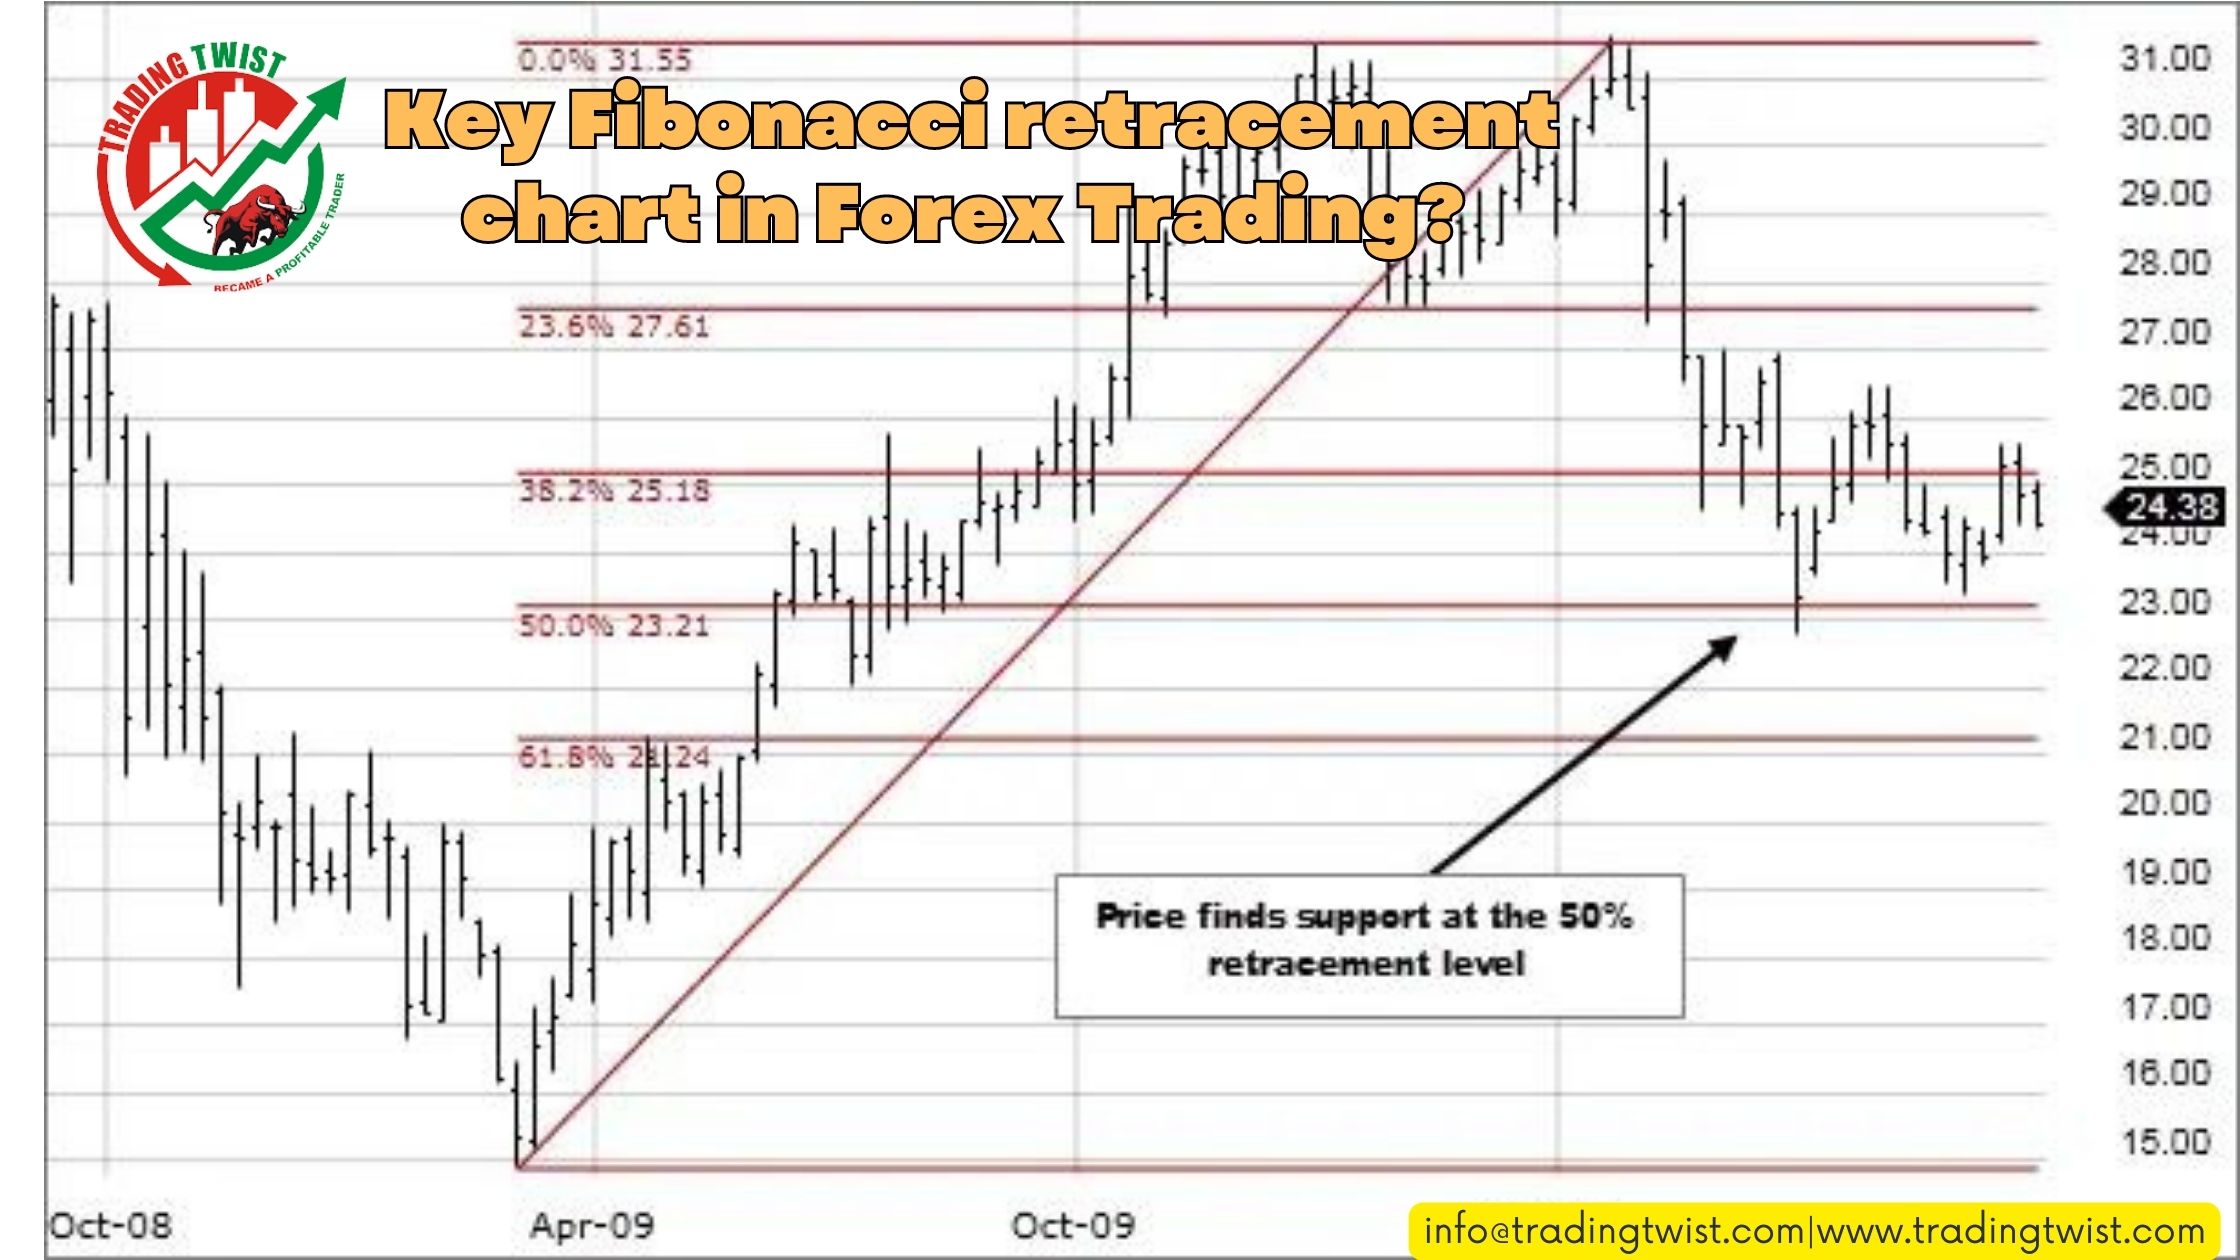
The Fibonacci sequence can be applied to the forex market by dividing a price range into sections based on the golden ratio. The most common Fibonacci levels used by traders are 23.6%, 38.2%, 50%, 61.8%, and 100%. These levels are calculated by taking the difference between the high and low of a price movement and multiplying it by the corresponding Fibonacci ratio. For example, if the high is 1.2000 and the low is 1.1000, then the difference is 0.1000. Multiplying this by 0.236 gives us 0.0236, which is then added to the low to get the 23.6% level at 1.1236.
The Fibonacci levels can act as potential areas of support and resistance where the price may bounce or reverse. Traders can use these levels to enter or exit trades, set stop losses or target profits, or identify trend continuation or reversal patterns. Here are some tips on how to trade key Fibonacci chart levels in forex trading:
- Use fibonacci retracement chart to identify pullbacks within a trend.
- Use Fibonacci extensions to project potential targets for a price movement.
- Use Fibonacci fans to identify dynamic support and resistance levels.
- Use Fibonacci arcs to identify potential turning points in a price movement.
Use Fibonacci retracements to identify pullbacks within a trend
A retracement is a temporary reversal of the dominant trend direction that offers an opportunity to join the trend at a better price. To draw Fibonacci retracements on your chart, you need to identify a significant swing high and low in the direction of the trend and connect them with a Fibonacci tool. The resulting levels will show you where the price may find support or resistance during the retracement. For example, if you are in an uptrend and the price pulls back to the 38.2% level, you can look for a bullish signal to enter a long trade near that level.
Use Fibonacci extensions to project potential targets for a price movement
An extension is a continuation of the dominant trend direction that goes beyond the previous swing high or low. To draw Fibonacci extensions on your chart, you need to identify three points: a significant swing high and low in the direction of the trend and the end of the retracement. The resulting levels will show you where the price may reach after breaking out of the retracement. For example, if you are in an uptrend and the price breaks above the previous swing high, you can use the Fibonacci extension levels to set your profit target at the next higher level.
Use Fibonacci fans to identify dynamic support and resistance levels.
A fan is a set of diagonal lines that are drawn from a significant swing high or low and intersect with the Fibonacci retracement levels. The resulting lines will show you how the price may follow a certain slope or angle as it moves along the trend. For example, if you are in an uptrend and the price bounces off the lower fan line at the 38.2% level, you can expect it to rise towards the upper fan line at the next higher level.
Use Fibonacci arcs to identify potential turning points in a price movement.
An arc is a curved line that is drawn from a significant swing high or low and intersects with the Fibonacci retracement chart at a certain distance from the origin point. The resulting arcs will show you how the price may move in a circular or elliptical pattern around the origin point. For example, if you are in an uptrend and the price reaches the outer arc at the 61.8% level, you can anticipate a possible reversal or correction at that level.
Fibonacci levels are not exact or guaranteed indicators of price behavior, but rather probabilistic tools that can help you gauge market sentiment and psychology. They can also complement other technical analysis methods such as trend lines, moving averages, candlestick patterns and indicators. By using Fibonacci levels wisely and with proper risk management, you can enhance your forex trading performance and profitability.