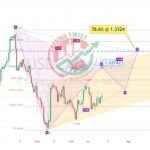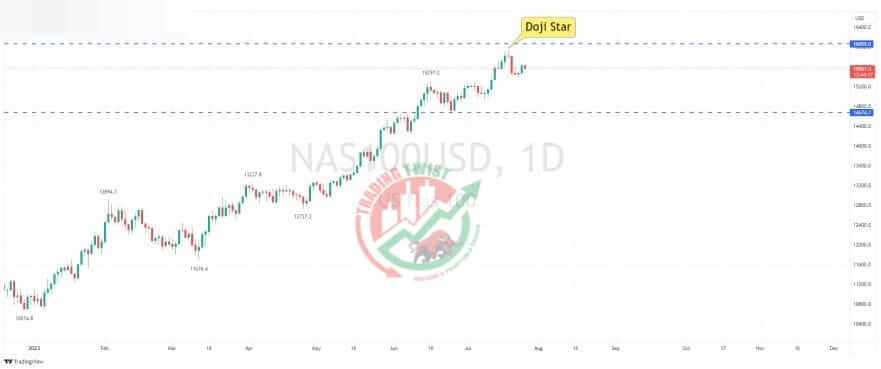
Nasdaq100 Chart Technical Outlook perspective there are a few aspects that offer negative bias. The daily chart posts an evening doji star. Intraday chart highlights the completion of an ascending triangle formation target. I think if we break this weeks swing low we will head lower towards the next support zone close to 14,675