
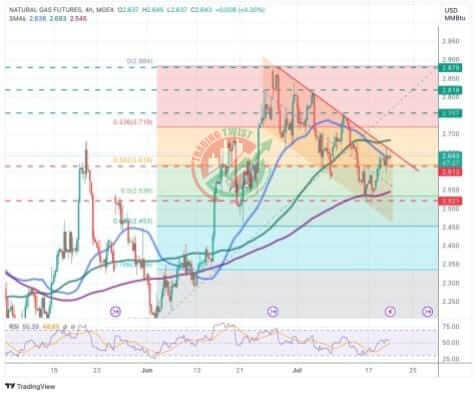
Natural Gas (NG) Chart Technical Outlook Gas prices’ rebound from 2.50 lows has reached the confluence of the 4H 50 and 100 SMAs with trendline resistance from late June highs, at the 2.65 area.
A confirmation above that level would cancel the downside trend and increase bullish traction towards 2,75 and 2.80 before testing the June 28 high at 2.87.
If the mentioned trendline is honoured, bears will take back control and push price action beyond 2.61 to 2.52 ahead of the channel bottom, at 2.45.
Natural Gas (NG) pushing against an important resistance area at 2.65*
Natural; Gas prices’ rebound from 2.50 lows has reached the confluence of the 4H 50 and 100 SMAs with trendline resistance from late June highs, at the 2.65 area.
A confirmation above that level would cancel the downside trend and increase bullish traction towards 2,75 and 2.80 before testing the June 28 high at 2.87.
If the mentioned trendline is honoured, bears will take back control and push price action beyond 2.61 to 2.52 ahead of the channel bottom, at 2.45.


