
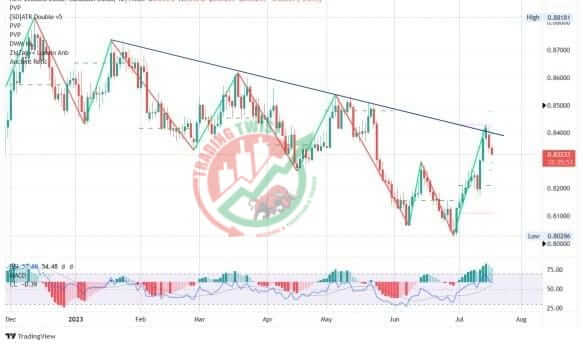
NZDCAD Chart Technical Outlook bounces lower from the falling trend line, bears eye 0.8290
NZD/CAD broke above June’s high to test the falling trendline resistance. It bounced lower from there ahead of the two countries’ CPI data due this week.
The BoC can be more hawkish than the RBNZ. But, technical indicators and retailers’ sentiment are bullish.
I expect the current pullback to resume until more clues from the Inflation data.
Since the pair correlates positively with stocks, more declines can be expected if sentiment deteriorates.
Resistances: 0.8390, 0.8425
Supports: 0.8290, 0.8260


