
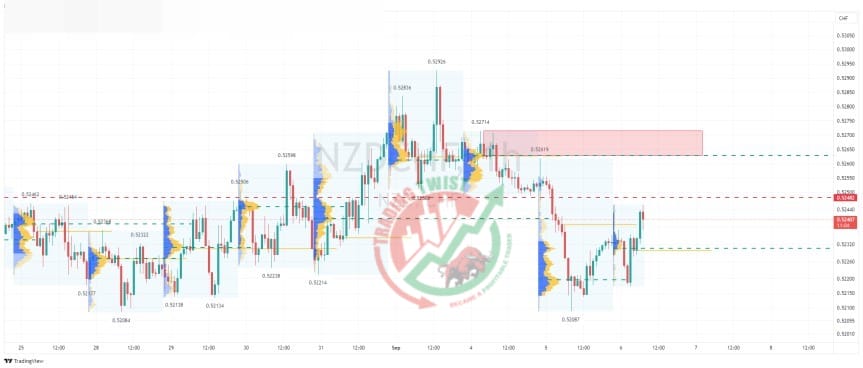
NZDCHF Chart Technical Outlook the upside barrier is located at 0.5262
The daily chart highlights mixed and volatile trading for the last 12 days. Although we have seen a correction to the upside from yesterday’s swing low of 0.5209, the rally could be limited. We have a substantial upside barrier at 0.5262. This is:
- The point of control from Monday, September 4 (open)
- the supply zone
- bespoke resistance


