
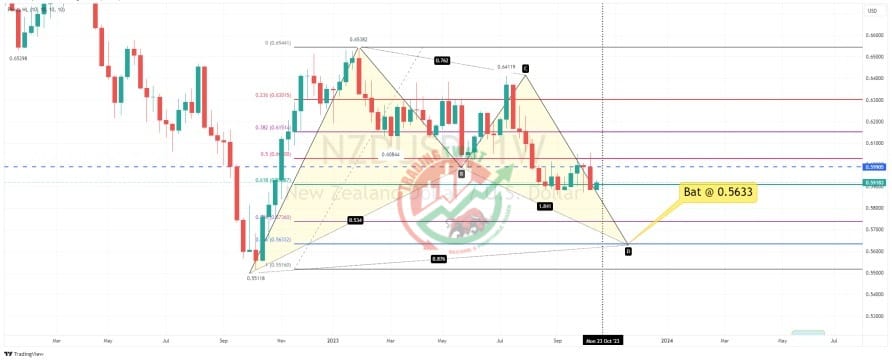
NZDUSD Chart Technical Outlook the medium-term focus remains on 0.5633
The weekly chart highlights the completion of a Bat formation at 0.5633.
The daily chart highlights mixed and volatile trading for the last 40 days. This has resulted in an expanding wedge formation being posted. This formation has a negative bias.
With bespoke resistance located at 0.5990 and the 61.8% pullback level of the last decline located at 0.5989, this would be our prime level to get short.


