
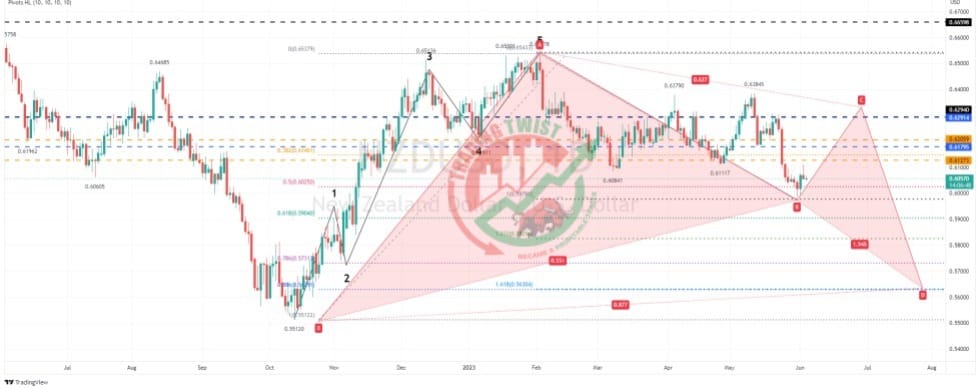
NZDUSD Chart Technical Outlook reacts higher from levels close to the confluence support barrier of 0.5979
The daily chart highlights an Elliott Wave pattern completed on the 2nd of February at 0.6538. We have been in the corrective cycle lower. We have a projected support level of 0.5979 for a large Bat formation. This would suggest that our next medium-term move is to the upside.
Breaking down into shorter time frames and we have completed a bullish Elliott Wave count (5 waves). The move lower from Friday’s high is corrective. A common support level for this wave is the 78.6% pullback from the last rally. This is located at 0.6012.


