
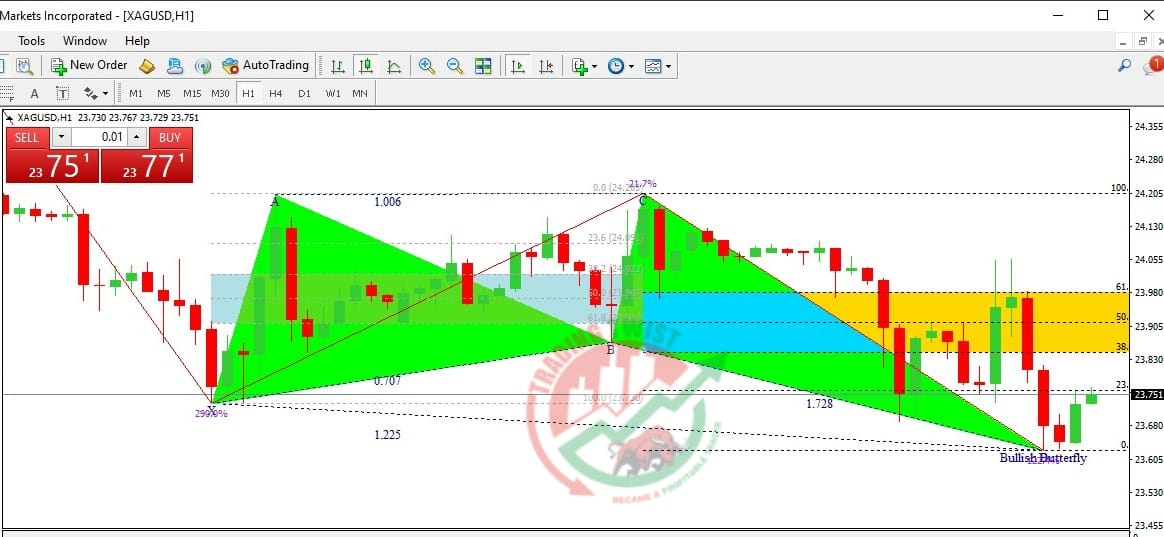
Silver XAGUSD Chart Technical Outlook We have a Bullish Butterfly pattern confirmation, prices slide as US retail sales data spur a jump in US Treasury bond yields, driving XAG/USD down to six-week lows around $23.64.
•Technical outlook shows a double-top chart pattern with XAG/USD between 50 and 100-day EMAs, while a bearish RSI suggests further declines may be imminent.
•XAG/USD could target the $22.90 level if the 100-day EMA is breached while reclaiming the $24.00 figure could pave the way for a rally toward the 50-day EMA and potentially $25.00.


