
This article is a brief explanation of some of the fundamental concepts in trading. It explains the idea behind Support and Resistance, how they are formed and what they represent.
Support and Resistance: these two terms are used by traders to describe a certain area of prices, either in a stock, commodity, or currency market. If the price is fluctuating near the same high level but can’t manage to break through that level, it’s called resistance. The point where the stock breaks into new high levels are called support.
What are support and resistance?
In the stock market, these are key levels that the price has a hard time breaking through. These levels can be used by traders to enter or exit positions.
Support is the level at which price finds it difficult to fall below. This is because there is an increase in buying interest at this level. Resistance is the level at which the price finds it difficult to rise above. This is because there is an increase in selling interest at this level.
These levels are not always exact and can be broken through on occasion. However, they do tend to hold over time and can be used as a guide for trading.
How do support and resistance work?
When it comes to the stock market, support and resistance are key terms that you need to understand. Support refers to the price level at which demand is thought to be strong enough to prevent further price declines. In other words, it is the floor that prices will not fall below in the short term. On the other hand, resistance is the price level at which selling is thought to be strong enough to prevent further price increases. In other words, it is the ceiling that prices will not rise above in the short term.
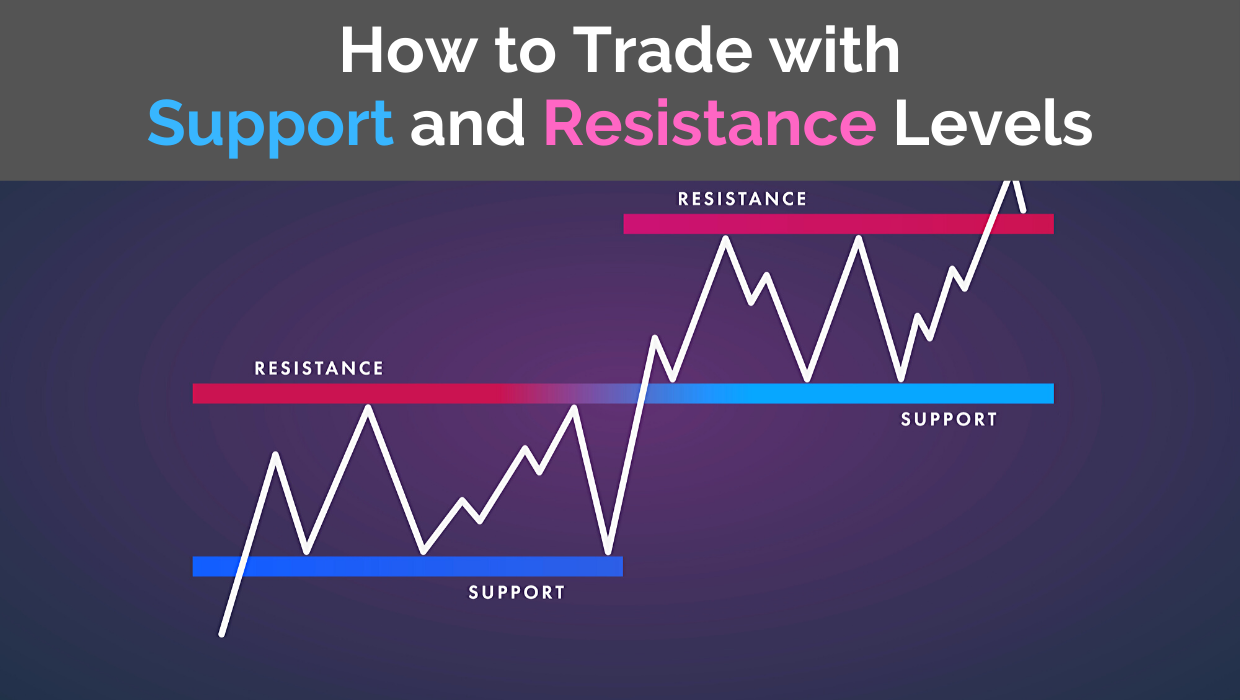
So how do these levels come about? Well, they are typically formed by past price action. For example, if a stock has fallen sharply and then stabilized at a certain level, that level could be seen as potential support. Similarly, if a stock has risen sharply and then stabilized at a certain level, that level could be seen as potential resistance.
It’s important to note that these levels are not exact; they are simply levels where buying or selling is thought to be more likely than usual. And while they can provide some guidance as to where prices may head in the short term, they are by no means guaranteed. Prices can and do break through both levels on occasion.
What happens when support or resistance levels are broken?
When a level is broken, it can signal a change in the trend of the stock market. If a support level is broken, it can mean that the stock market is going to start trending downward. If a resistance level is broken, it can mean that the stock market is going to start trending upward.
A key concept of technical analysis is that when a level is broken, its role is reversed. If the price falls below a support level, that level will become resistance. If the price rises above a resistance level, it will often become support.
How to determine if support or resistance has been broken or not?
When stock prices are bouncing up and down between two levels, those levels are called support and resistance. Support is the level at which prices find some buying interest and stop falling. Resistance is the level at which prices find some selling interest and stop rising.
The key to successful trading is to buy near support and sell near resistance. That way, you’re buying low and selling high. The problem, of course, is trying to determine where those levels are.
There are a number of ways to do this, but one of the simplest is to just use a price chart. Look for areas on the chart where the price has bounced off multiple times. These are likely to be areas of significant support or resistance.
Another way to determine if support or resistance has been broken is by looking at volume. When prices break through an area, there should be a significant increase in volume. This indicates that there is real interest in the move and that it’s likely to continue.
If you see a breakout in low volume, be wary. It may just be a false move that will quickly reverse itself.
How to identify whether the support or resistance will hold or break?
When it comes to the stock market, there are a few key things to look for in order to identify whether it will hold or break. First, you want to look at the volume of trading activity. If there is a high volume of trading activity, then this is a good sign that the support or resistance is likely to hold.
Second, you want to look at the price action. If the price is bouncing off of the levels, then this is another good sign that the level is likely to hold. Finally, you want to look at the trend. If the trend is strong, then it is more likely that the support or resistance will hold.


Great, keep up the good work