One of the most important aspects of technical analysis is the use of the trading indicator. Indicators are mathematical calculations that are used to analyze past price data and help predict future price movements. There are many different trading indicators available, and each one can be used in different ways.
Some indicators are trend-following, meaning they can help you identify when a market is trending up or down.
To help you sort through the different technical indicators out there, we’ve compiled a list of the top best indicators for technical forex trading scalping. These trading indicators have been chosen based on their ability to provide accurate and timely information that can help you make better trading decisions.
List of the best technical trading indicator
1. Moving average (MA)
A moving average (MA) is a technical trading indicator that shows the average price of a security over a set period of time. MAs are popular tools among technical traders and are used in numerous ways, including to identify trends, support, and resistance levels, and to set up trading strategies. There are many different types of MAs, but the most common are simple moving averages (SMAs), which are calculated by adding up the prices of a security over a set number of periods and then dividing by that number.
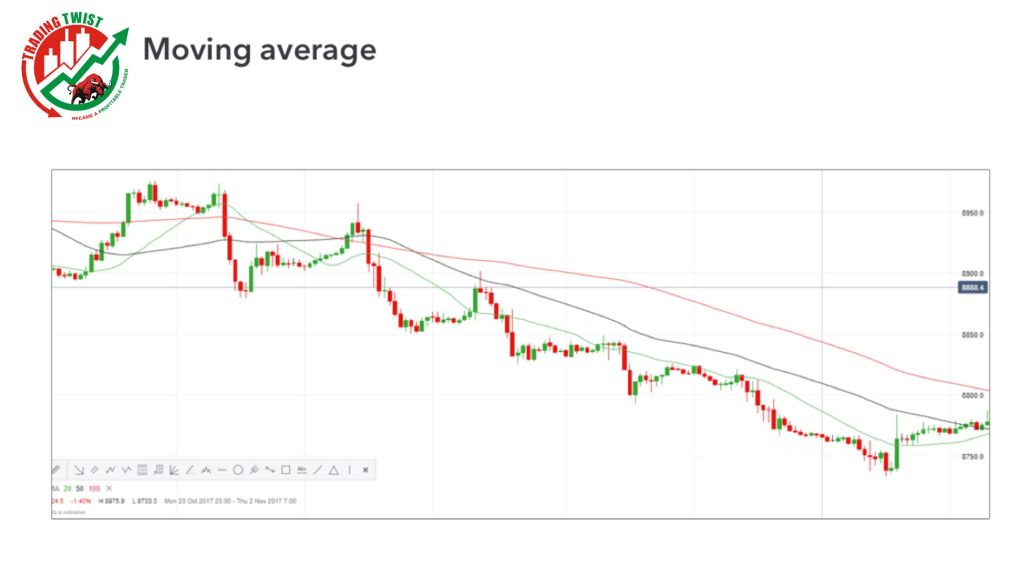
The MA is a lagging indicator, meaning it trails the price action of a security. MAs are considered lagging because they are based on past prices. This lag can be used as a trade signal, as traders may look to buy or sell a security when its price crosses above or below the MA.
MAs are often used in conjunction with other technical indicators, such as support and resistance levels, to form a complete trading strategy.
2. Exponential moving average (EMA)
An exponential moving average (EMA) is a type of moving average that is similar to a simple moving average, except that more weight is given to the most recent data. The exponential moving average is also known as the exponentially weighted moving average.
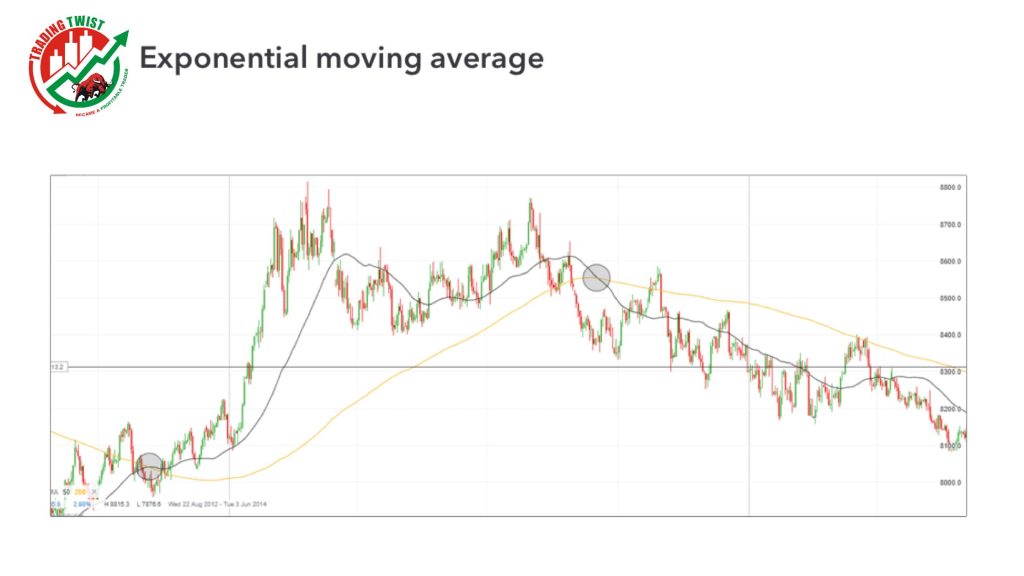
The exponential moving average is used in technical analysis as a momentum indicator and as a trend-following indicator. The EMA is also used as a component of other indicators, such as Bollinger Bands and the MACD.
The formula for the exponential moving average is:
EMA = Price(t) * k + EMA(t-1) * (1 – k)
where:
Price(t) = the price at time t
k = the smoothing factor
EMA(t-1) = the exponential moving average at time (t-1)
The exponential moving average is considered a type of weighted moving average because it gives more weight to recent data.
3. Stochastic Oscillator
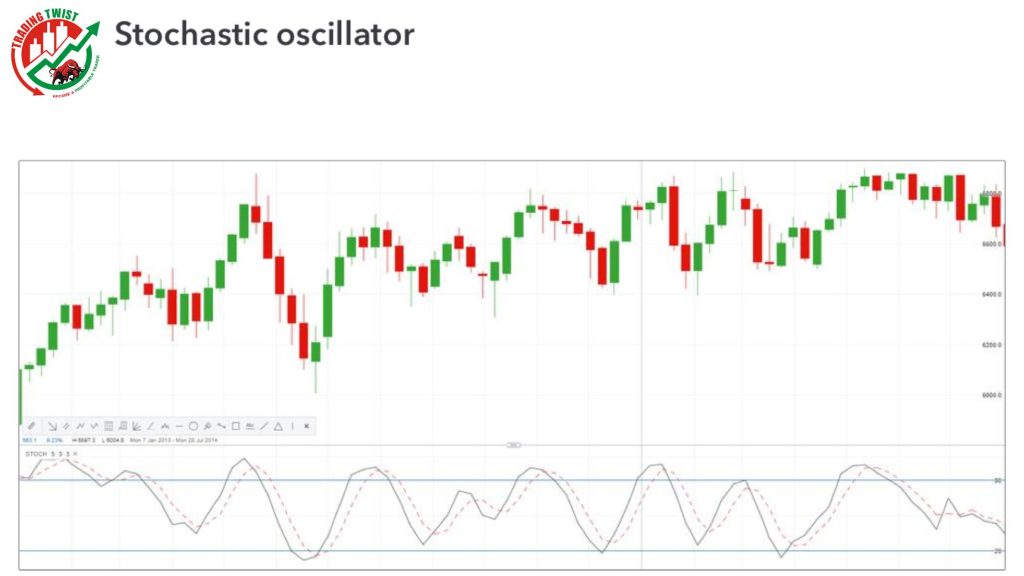
The stochastic oscillator is a technical trading indicator used in the analysis of financial markets. It is intended to track the momentum of price changes in order to identify potential overbought or oversold conditions.
The stochastic oscillator is calculated using the following formula:
%K = 100(C – L14)/(H14 – L14)
where:
%K is the current stochastic oscillator value
C is the most recent closing price
L14 is t
H14 is the high of the 14 previous trading days
The resulting value is then plotted on a scale of 0 to 100, with values below 20 considered oversold and values above 80 considered overbought.
The stochastic oscillator can be used as a standalone trading indicator or in conjunction with other technical indicators to form a trading strategy.
4. Moving average convergence divergence (MACD)
MACD is a technical analysis tool that is used to measure momentum. It is the difference between a 26-day exponential moving average (EMA) and a 12-day EMA.
MACD is used to identify trend changes and to signal the end of corrections. It can be used to confirm other technical indicators, such as breakouts. MACD is a lagging indicator, which means that it trails price action.
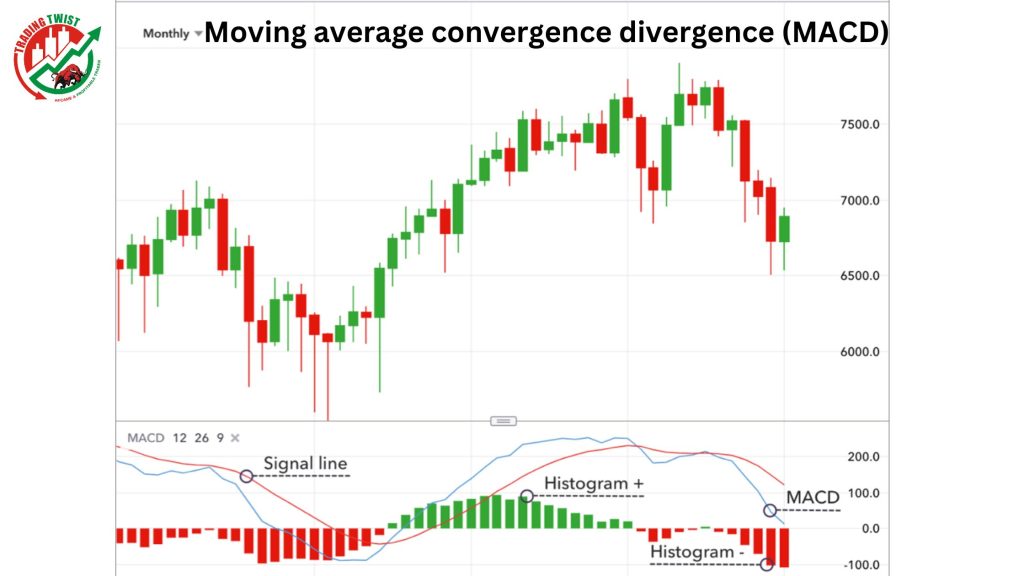
MACD has two parts: the MACD line and the signal line. The MACD line is the difference between the 12-day and 26-day EMAs. The signal line is a 9-day EMA of the MACD line.
MACD is calculated by subtracting the 26-day EMA from the 12-day EMA. This difference is then plotted on a chart with a horizontal zero line. A 9-day EMA of the MACD line is also plotted on the chart and is called the signal line.
5. Bollinger bands
Bollinger Bands are one of the most popular indicators used by traders in all markets. The Bollinger Band trading indicator was developed by John Bollinger in the 1980s. Bollinger Bands consist of a set of three curves drawn in relation to price. The middle band is a simple moving average that is normally set at 20 periods.
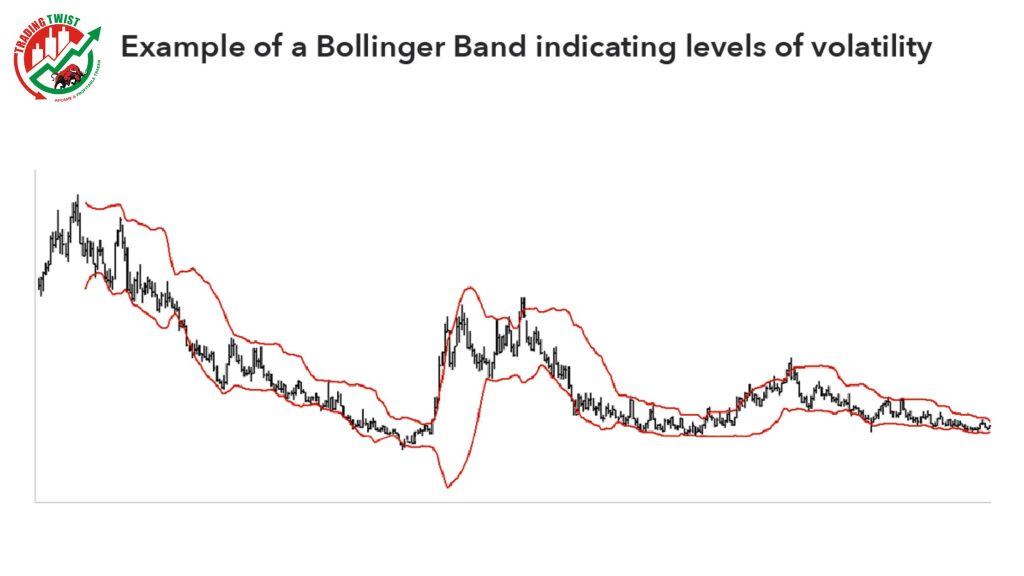
The upper and lower bands are usually set 2 standard deviations above and below the middle band. The standard deviation is a measure of volatility, so the Bollinger Bands adjust themselves to the market conditions. When the markets are relatively quiet, the bands contract, and when the markets are very volatile, the bands expand.
The Bollinger Bands can be used to trade a number of different strategies. One of the most popular is to use the bands to trade Bollinger Bands squeezes. A Bollinger Bands squeeze occurs when the volatility of the market decreases and the Bollinger Bands tighten or contract. This often happens before a big move in the market.
6. Relative strength index (RSI)
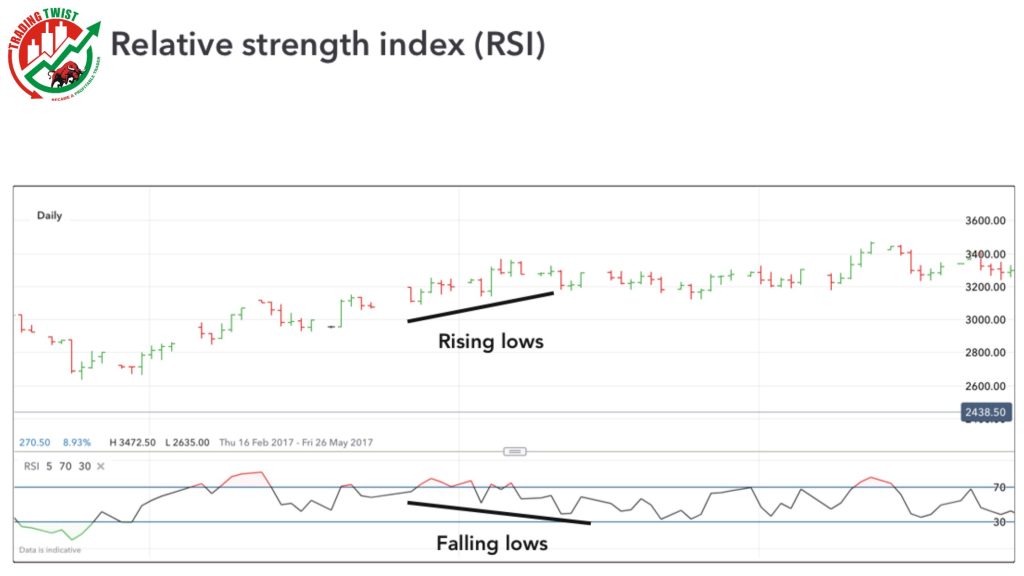
RSI is a momentum indicator that measures the speed and change of price movements. RSI oscillates between zero and 100. Readings below 30 indicate an oversold condition, while readings above 70 indicate an overbought condition.
7. Fibonacci retracement
Fibonacci retracement is a popular tool that technical traders use to help identify strategic places for transactions, stop losses, or take profits.
The theory is that after a major price move, the new price action will retrace a portion of that move before resuming in the original direction.
Fibonacci retracement levels are calculated by taking the high and low points of a price move and dividing the vertical distance by the key Fibonacci ratios of 23.6%, 38.2%, 50%, 61.8%, and 100%.
Once these levels are identified, horizontal lines are drawn and used as potential support and resistance levels.
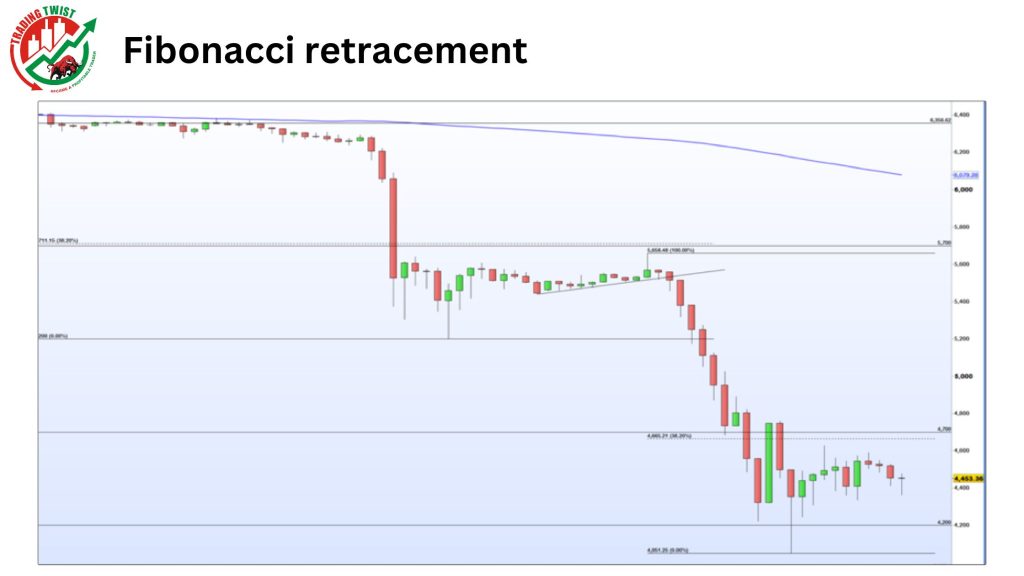
Traders will watch for price action to stall or reverse at these levels, which can be used as clues for where to enter or exit a trade.
Fibonacci retracement is just one tool that traders use to make decisions, and it should not be used in isolation.
Some important tips need to know before using a trading indicator
Are you thinking about using trading indicators to help you make decisions in the market? If so, there are a few things you need to know before using them.
First, it’s important to understand that indicators are simply tools, and they are not perfect. They can help you make better decisions, but they can also lead to bad decisions if you don’t use them correctly.
Second, different indicators can give you different results. This is why it’s important to test out different indicators before using them live.
Third, even the best indicators will only be as good as the data you feed them. If you’re using bad data, you’re going to get bad results.
Fourth, indicators are not a replacement for your own analysis. They should only be used as a supplement to your own market research.
Another thing to keep in mind is that you must never lose sight of your trading plan. Your rules for trading should always be implemented when using indicators.
To practice using trading indicators, try the FBS demo account.
Or, if you’re ready to start trading, open a live account.
Join the live trading stream.


